FIT Scholar
Archive

Category: Subject

  • Optimizing refugee relocation: Stable matching theory and OMOPSO algorithm for equitable and efficient allocation in Middle East

    Trần Hải Nam – 2201040119Nguyễn Thị Hạ Vy – 2301040204
    Phan Thuỳ Ngân – 2201040126Phùng Đinh Linh Ngân – 2201040127
    Nguyễn Ngọc Lan – 2201040093Nguyễn Thị Thuỷ Chung – 2201040024
    Nguyễn Thị Tuyết – 2201040163Nguyễn Thị Mai Phương – 2201040142

    ABSTRACT 

    Middle East geopolitical conflicts have led to a profound refugee crisis, leaving millions to languish in overcrowded encampments while provinces grapple with a disparate distribution of displaced persons. This imbalance places undue strain on infrastructure, exacerbates social tensions, and heightens security concerns, emphasizing the urgent need for a carefully designed resettlement strategy. To tackle this issue, Stable matching theory (SMT) was applied as a mathematical framework to find efficient and stable pairings between refugees and host provinces, optimizing mutual satisfaction and fostering long-term sustainability. Beyond optimizing refugee allocation, the research outcomes underpin national policy reforms, address complex social challenges, and foster multi-stakeholder collaboration. Specifically, our study proposes an integrated approach leveraging the Gale-Shapley algorithm (GSA) within the SMT framework and enhancing it through OMOPSO – a multi-objective optimization technique. Building upon this foundation, the approach supports stable matching under multiple constraints by GSA, and achieves fair refugee distribution across provinces due to OMOPSO balancing multi-objective criteria such as life quality, health, and financial.

    Keywords: Stable matching theory, Gale-Shapley algorithm, OMOPSO algorithm, refugee relocation, efficient allocation.

    I. Introduction

    1.1.  Background

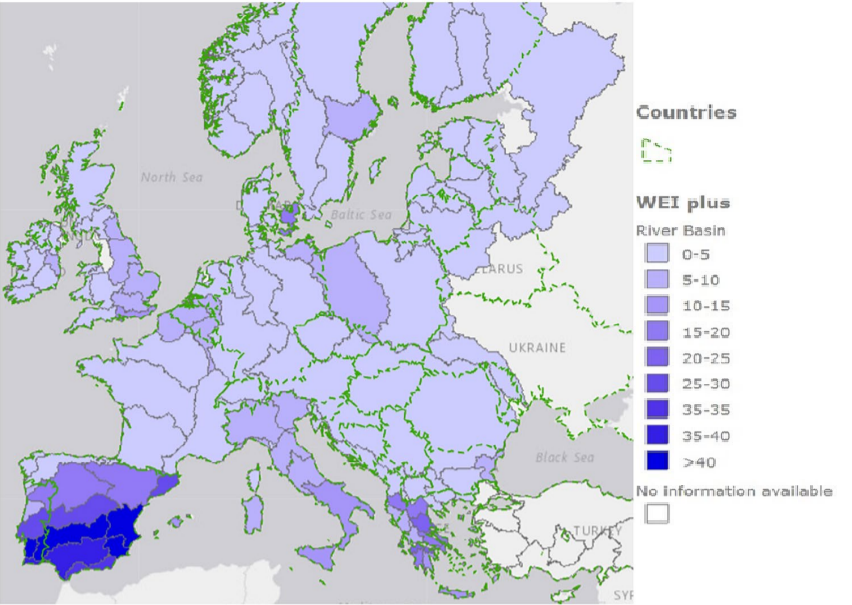
    The uneven distribution of refugees within host countries like Jordan and Lebanon has led to severe socio-economic challenges, straining infrastructure, public services, and social cohesion in provinces hosting refugees. In Jordan, urban centers such as Amman, Irbid, and Mafraq collectively host over 70% of refugees, while in Lebanon, the Beqaa Valley alone accommodates around 36.1%, creating regional disparities [1], [2]. Overcrowded schools in these areas operate on double shifts, reducing education quality, while healthcare systems struggle to meet rising demands. These pressures exacerbate tensions between locals and refugees, as international aid often prioritizes the latter, fueling social divides [3]. Beyond the Middle East, the crisis has affected Europe, where the EU introduced the European Agenda on Migration to manage asylum seekers through measures like the “hotspot” approach and emergency relocation plans. However, opposition from member states led to the failure of the relocation scheme, sparking legal disputes and limiting the Agenda’s effectiveness [4].

    Figure 1: Distribution of refugees in Jordan provinces

    The refugee crisis has become a complex issue, with challenges including the uneven distribution of refugees and inadequate integration policies. According to the World Bank, this strain overwhelms border regions and urban centers, leading to overcrowded facilities and overburdened healthcare systems [5]. In Lebanon, major cities face the most pressure, while other areas with available capacity remain underused. Figure 2 illustrates the shift in health expenditure, with government spending rising from 43% in 2012 to 45% in 2017, while out-of-pocket expenses fell from 37% to 33%. In high refugee-density areas, the growing demand for medical services intensifies these financial pressures, raising concerns about equitable and sustainable healthcare access for both host populations and refugees [6].

    Figure 2: Sources of Lebanese health expenditure (%)

    This led to logistical challenges and social tensions between refugees and local communities. The inadequacy of short-term integration policies, like temporary shelters, underscored the need for long-term solutions addressing refugees’ ongoing needs in education and employment [7]. Aligning refugee relief with sustainable integration policies is crucial to balance resources, reduce tensions, and enable refugees to contribute meaningfully to host provinces.

    SMT provides a theoretically sound and practically efficient framework for solving complex allocation problems such as refugee resettlement. It ensures mutually beneficial and conflict-free matching based on preference rankings [8]. Developed by Lloyd Shapley and applied by Alvin Roth to real-world scenarios like organ donation and school choice, the work earned them the Nobel Prize in 2012 and has proven to be widely applicable [9]. A key component of SMT is the Gale-Shapley algorithm, which achieves stable matchings by having one group propose to the other based on their preferences, with proposals being accepted or rejected iteratively until a stable arrangement is reached [10]. Teytelboym emphasizes that this mechanism is particularly suitable for refugee allocation because it balances refugee needs with local preferences and capacity constraints, thereby reducing the likelihood of conflicts [11]. To further improve allocation outcomes, we integrate SMT with multi-objective evolutionary algorithms such as OMOPSO, which allow for the simultaneous optimization of multiple fairness and efficiency criteria.

    To enhance refugee allocation efficiency, Multi-Objective Evolutionary Algorithms (MOEAs) are employed for their ability to optimize conflicting objectives and generate a Pareto approximation set in a single run for multi-objective problems (MOPs) [12]. Among them, Particle Swarm Optimization (PSO) is recognized for effectively exploring the search space by generating a densely distributed solution population through its arithmetic mechanism [13]. A notable PSO-based MOEA is OMOPSO [14], which pioneered the use of ɛ-dominance in many-objective optimization, improving its ability to handle high-dimensional decision-making. 

    Figure 3. Average GD to the Pareto’s ideal front by each algorithm [17]

    As shown in Figure 3, OMOPSO achieves the smallest Generational Distance (GD) to the Pareto ideal front, indicating its strong convergence capability in refugee allocation tasks. This confirms its effectiveness in producing solutions close to the true Pareto front. OMOPSO successfully balances conflicting objectives such as economic viability, social integration, and humanitarian needs [15]. Its optimization superiority over other algorithms has been validated in several studies [16]. Thus, OMOPSO emerges as a reliable and practical tool for supporting decisions in refugee allocation, offering optimal trade-offs between competing factors in complex real-world scenarios [17].

    1.2.  Related work

    This section examines major research on refugee distribution processes and integration techniques in various locations, including Europe and the Middle East. It emphasizes the development of approaches for successful refugee allocation that not only consider preferences and capabilities but also promote long-term integration and well-being. Additionally, the review identifies gaps in current models, highlighting the need for more effective solutions. As a result, this study aims to provide improved techniques for refugee distribution that promote justice, stability, and efficiency.

    In the field of refugee allocation, previous studies have combined both optimization algorithms and policy analysis.  For instance, the study by Hagen applied a quota adjustment algorithm based on mechanism design for fair, efficient, and strategy-proof allocation [18]. Similarly focused on fairness, Armas et al. employed multi-objective optimization with integer linear programming to balance integration, host priorities, and refugee preferences [19]. Conversely, Janmyr and Stevens analyzed legal and policy frameworks to demonstrate flexible protection in the Middle East, while Nandy’s media analysis revealed how narratives influence migration policy [20], [21]. These approaches deepen understanding of refugee allocation, with positive contributions to fairness and efficiency tempered by practical and societal challenges.

    Next, the social integration challenges are highlighted by Almohamed et al., including cultural barriers, language obstacles, and stereotypes [22]. Moreover, Klugman et al. pointed out gender inequalities in refugee policies, particularly restrictions on women’s [23]. As Figure 4 summarizes, the 10 largest refugee-hosting countries imposed more than 75 economic restrictions on women, including limitations on business, banking, and property ownership. Over the past decade, while Colombia and Pakistan made gradual progress, most host nations retained restrictive policies. Thus, the role of refugee-led organizations in Jordan, Lebanon, and Turkey shows how they provided essential aid, social protection, and cultural support despite legal and financial obstacles [24]. 

    Figure 4: Number of legal barriers to women’s employment in the 10 largest refugee-hosting countries [23]

    Building on these insights, research on refugee allocation has explored mathematical models to optimize outcomes. Álvarez stated that relocation mechanisms often struggled with inefficiencies in preference matching and fairness [25]. Taking a different route, Bansak & Paulson showed that machine learning could significantly enhance refugee employment outcomes by up to 70% [26]. Besides, Xepapadeas and Mourtos developed sequential and cooperative allocation mechanisms that achieve Pareto efficiency [27], whereas Aziz et al. created a strategy-proof algorithm for stable matching [28]. Expanding on optimization models, Jones and Teytelboym emphasized that matching theory effectively balances refugee and host preferences, similar to school choice mechanisms [29]. Cilali et al. argued that socio-cultural and logistical factors went beyond numerical allocation [30]. Figure 5 illustrates these complexities, highlighting challenges such as camp expansion, resource management, and service provision.

    Figure 5: Refugee-related problems [30]

    In addition, Ahani et al. introduced a stochastic programming model that outperformed traditional allocation methods in real-world applications [31], while Delacrétaz et al. advocated for preference-based mechanisms to enhance overall efficiency [32]. Together, these studies underscore the importance of stability-driven, optimized strategies for improving refugee resettlement.

    Although many previous studies have explored refugee allocation using various algorithms and matching strategies, three significant research gaps remain. Firstly, existing studies have either focused on stability such as HFPDA [28] and Pareto optimization [30], but none have systematically integrated both in the context of refugee allocation at the provincial level. Additionally, some previous studies have applied heuristic algorithms, machine learning, or optimization techniques [26]. Still, none leveraged OMOPSO algorithm in combination with SMT (particularly, Gale-Shapley algorithm) to identify Pareto-optimal allocations in a multi-objective and conflicting space. Finally, most prior studies have considered only a one-time static allocation without accounting for changes in economic, political, or security conditions, like Hagen criticized the EU’s rigid quota system [21].

    ContributionAlgorithm / Matching typeAuthor and Publication
    Distributing refugees within the EUQuota adjustment mechanismHagen [18]
    Improve decision-making in refugee resettlementMulti-objective integer linear programming (ILP) model Armas et al. [19]
    How refugee protection works, looking at international laws, agreements in the areaAnalyzes legal frameworks, state policies, institutional roles, and humanitarian practicesJanmyr,  Stevens [20]
    Analyzes specific refugee crisis portrayals, ethical, political media rolesComparative case study approach to match media sources or themes across regionsNandy [21]
    Designing RAS support technology during resettlementConceptual FrameworkAlmohamed et al. [22]
    Improving international community responds to global refugee crisesComprehensive Refugee Response Framework (CRRF)Klugman et al. [23]
    Describing what RLOs doQualitative analysisEl-Abed [24]
    Syrian refugee allocation by quotasYou Request My House – I Get Your Turn (YRM-HIGHT) and Deferred Acceptance (DA).Álvarez [25]
    Monte Carlo load balancingMonte Carlo simulations, load balancingBansak,  Paulson [26]
    Developed sequential and cooperative allocationPareto-optimalXepapadeas, Mourtos [27]
    Efficient, fair refugee assignmentHierarchical Family-Proposing Deferred Acceptance (HFPDA)Aziz et al. [28]
    Pareto-optimal matching strategiesPareto-optimal matchingJones, Teytelboym [29]
    Proposal multi-goal solutionPareto-optimalCilali et al. [30]
    Dynamic matching modelAnnie MOORE optimization (Matching and Outcome Optimization for Refugee Empowerment), dynamic matchingAhani et al. [31]
    Matching with multidimensional knapsack constraintsPreference-based matching mechanismsDelacrétaz et al. [32]

    Table 1: Summary of recent related research papers by algorithms

    1.3. Key Contributions

    A well-planned resettlement strategy must balance equity and practicality to create sustainable solutions. Therefore, identifying adequate housing for refugees is a complex task that requires careful assessment of local resources and economic conditions. To address these pressing issues, this study delves into three fundamental questions:

    1. What key criteria should be prioritized when allocating refugees to provinces to improve economic integration and prevent inefficient resource use?
    2. What models does the system use to match refugees to provinces?
    3. How is the refugee allocation problem addressed to optimize efficiency? 

    In this study, to effectively allocate refugees to provinces, several essential factors are explored. Through a comprehensive literature review and expert insights, we identify criteria that impact allocation balance, including refugees’ skills and the specific needs of host provinces. Outlining these factors helps establish a balanced refugee distribution, preventing undue pressure on local resources. 

    Additionally, refugee allocation can be optimized using three interconnected models. The Refugee-Province Compatibility Model (RPCM) focuses on aligning refugee characteristics with provincial attributes. Second, the Matching Pair Quality Model (MPQM) evaluates the strength of each pairing. Lastly, the Optimal Fit Calculation Model (OFCM) refines these pairings by prioritizing long-term integration that benefits both refugees and host provinces.

    Therefore, the refugee allocation problem is addressed by combining the strengths of Gale-Shapley’s, SMT and OMOPSO. SMT ensures stable pairings between refugees and host provinces based on mutual preferences. OMOPSO then refines these matchings by optimizing key objectives. This hybrid approach enhances overall efficiency by balancing stability with optimal resource allocation, leading to reduced mismatches and improved integration outcomes.

    This research presents an innovative approach to refugee allocation by integrating the OMOPSO algorithm with SMT. Together, these advanced methodologies address critical challenges such as placement optimization, equitable resource allocation, and effective refugee-host region matching. The key contributions of this research are as follows:

    • This research proposes a decision-making framework that considers refugee skills, adaptability, and host infrastructure to ensure fair placement and evaluate long-term integration, balancing immediate needs with sustainable resettlement.
    • The framework integrates three models to provide a scalable and stable solution for refugee allocation: RPCM evaluates compatibility using Manhattan distance and OMOPSO; MPQM converts discrepancies into satisfaction via an exponential utility function; and OFCM assesses overall fit and ensures stability using the Gale–Shapley algorithm.
    • This hybrid model combines OMOPSO’s adaptive search with the stability of the Gale–Shapley method to enhance refugee placement. OMOPSO handles evolving crises, while Gale-Shapley ensures robustness despite incomplete data. This hybrid approach reduces quota waste, improves resource use, and offers a dynamic, data-driven solution for global allocation.

     II. Problem Definitions

    Our study focused on distributing refugees across different provinces within a single host country to prevent overcrowding, which posed challenges for both the local population and the refugees. This issue can be articulated as Refugee Allocation Optimization Issues (RAOI). In technical terms, the two players involved in RAOI, refugees and provinces, are categorized into limited sets R and P, respectively. 

    • The set of refugees is defined R =r0 ,.., rN, where each ri is the ith refugee in which 0iN, and  NN is the total number of refugees. 
    • The set of provinces within a host country is represented as P=p0, .., pM, where each pj is the jth province in which 0jM, and MN is the total number of provinces. 
    • Each province pj having a maximum capacity cj. 
    • The allocation is represented by the function: μ:R P{} , assign each refugee ri to at most one province pj such that the number of refugees at pj denoted |μ-1(pj)| does not exceed cj. 

    A stable matching is achieved when no blocking pair exists. No blocking pair means there is no ri and pj where: 

    • ri prefers pj over μ(ri) (or if unassigned).
    • pj prefers ri over at least one refugee in μ-1(pj) or has capacity remaining |μ-1(pj)| <cj. 

    If this happens, the allocation becomes unstable, leading to significant consequences. 

    To illustrate the research issue mentioned above, we use a tabular dataset on the distribution of refugees. The dataset includes three Middle Eastern refugees (Refugee 1 to Refugee 3) who are seeking resettlement in three distinct host provinces (Province 1 to Province 3). Each refugee has their own needs and expectations, similarly, each host province has specific capacities to meet these needs. The criteria for matching refugees with host provinces based on mutual compatibility are demonstrated below:

    FeatureExpected quality of life (HDI)Ability to obtain employment (%)Financial support (USD)Quality of life (HDI)Labor market capacity (%)
    r10.756030
    r20.655025
    r30.807040
    p1350.8565
    p2300.7555
    p3500.9075

    Table 2: Example dataset for RAOI in the Middle East

    Accurately defining the traits of both sides is essential to comprehend the connection between refugees and the provinces within the host country. The work of Bansak and Paulson [26] highlights key factors that help identify refugee needs and optimize their integration into host society.

    As measured by the Human Development Index (HDI), quality of life (riQL) is the most important factor. Additionally, the social housing ratio (riH), representing the proportion of state or nonprofit-provided apartments for specific groups, refugees’ health status (riHN), valued at 1 if medical issues are present and 0 otherwise. The ability to find employment (riJE), measured by the success rate of securing a job within two years of resettlement, and expected financial support (riJS), quantified in USD.

    For provinces, there should also be characteristics and constraints put in place to ensure the appropriateness of refugee reception, optimizing the use of available resources. In particular, high quality of life (pjQL), as reflected by the HDI, is often associated with better reception than places with less favorable living conditions.. Moreover,  well-developed social housing ratio (pjH) and health systems (pjHN) make it easier for refugees to access essential services and settle in effectively. In addition, the labor market capacity of the province is also a determining factor. Sectors with vibrant labor markets (pjLM), especially in occupations in which refugees have expertise, will facilitate their participation in the economy. Lastly, financial support (pjFS) provides refugees with essential resources to help them overcome the initial challenges of the settlement process.

    PlayersRefugees riProvinces pj
    Key CharacteristicsQuality of Life  (riQL)Quality of Life (pjQL)
    Employment Ability (riJE)Labor Market Capacity (pjLM)
    Social housing ratio (riH)Social housing ratio (pjH)
    Expected financial support (riFS)Financial support (pjFS)
    Health status (riHN)Health System (pjHN)

    Table 3: The characteristics of refugees and provinces

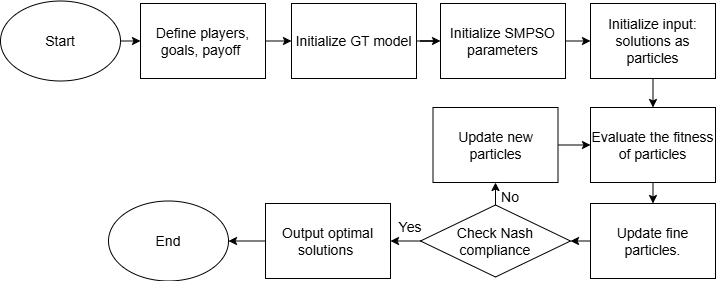
    The refugee allocation problem involves balancing multiple objectives: as highlighted by Bansak and Paulson [26], refugees tend to favor provinces offering a high quality of life(riQL) and job prospects (riJE), while provinces assess refugees based on labor capacity (pjLM) and financial needs (pjFS). These goals often conflict – provinces with jobs may lack financial resources, and desirable locations may face resource strain. The system uses OMOPSO for preference ranking and Gale-Shapley for stable matching, navigating trade-offs between integration, welfare, and sustainability. For example, a refugee needing aid (riFS) might be matched with a financially supportive province (pjFS) but with fewer job options, highlighting the tension between short-term needs and long-term outcomes. This iterative process is illustrated in the flowchart below, aiming to optimize social integration, economic stability, and resource efficiency while addressing the inherent tensions in multi-objective decision-making.

    Figure 6: The process modeling of the RAOI problem  

    The flowchart presents a method for allocating refugees in the Middle East. The process starts with collecting data on refugees, host provinces, and constraints. Next, the collected data is analyzed to extract key characteristics. To optimize allocation strategies, crossover combines existing allocation plans to generate diverse offspring solutions, while mutation introduces random adjustments to maintain solution diversity. After identifying feasible solutions, OMOPSO creates preference lists using multi-objective criteria. These are then input into the Gale-Shapley algorithm to form stable matches, followed by a fitness function to assess match quality for optimal refugee allocation.

    III. Methods

    3.1 Existing model 

    To address the RAOI, our research refers to ILP (Integer Linear Programming) – an established mathematical model originally designed for the Maximum size Stable Matching problem with Ties and Incomplete lists (MAX-SMTI) [33]. This model shares significant similarities with RAOI as they all involve constrained and prioritized matching problems under incomplete and possibly tied preference lists. In order to better illustrate the ILP model, the following table provides a detailed view of how each model component can be adapted:

    ComponentDescription
    AgentsM: Set of agents on one side.W: Set of agents on the other side.AMW: Set of acceptable pairs based on the preference lists.
    Decision Variablesxi,j=1 if  iM is matched to jW ,xi,j=0 otherwise.
    Objective FunctionFunction used to maximize the number of matched pairs:max (i,j)A xi,j
    Constraint 1Each agent is matched to at most one agent:iA(j)xi,j1 , jA(i)xi,j1
    Constraint 2Stability constraint:xi,j+i’ jixi’,j+j’ ijxi,j’1 for all unmatched (i,j)A
    Constraint 3Binary variables:xi,j{0,1} for all (i,j)A

    Table 4: The ILP formulation for the MAX-SMTI solving

    3.2 Model for RAOI

    Based on the characteristics and the requirements in the Problem Definitions section, the following mathematical model named RAOI will be introduced as follows:

      RAOI={(R, P), (ri,pj),Q(ri , pj),  f)}                                         

    Where:

    • R =r0 ,.., rN: A finite set of refugees, where each ri​ is the ith refugee,0iN, and  NN, and N is the total number of refugees.
    • P=p0, .., pM: A finite set of provinces in the host provinces, where each pj, is the jth province 0jM, and MN, and M is the total number of provinces. Each province pj​has a limited capacity (maximum number of refugees it can host).
    • ri =riQL, riJE, riH, riFS, riHN: Set of refugees, each with specific characteristics and preferences.
    • pj=pjQL, pjLM, pjH, pjFS, pjHN: Set of provinces, each with distinct capacities and attributes.
    • Q(ri , pj): Function to evaluate a province pj based on a refugee’s characteristics ri
    • f: Fitness function to evaluate the fitness value after matching iterations are terminated.

    This formulation outlines the basis of refugee-province allocation, with RAOI operationalized through three interconnected models RPCM, MPQM, and OFCM used sequentially for compatibility, satisfaction assessment, and overall optimization, as follows:

    1. RPCM assesses compatibility between refugee and city attributes using Manhattan distance, also known as the ‘city block distance’, forming the basis for evaluating mutual satisfaction [34]. The allocation is then optimized using OMOPSO, which effectively handles multiple objectives in the pairing process.
    2. MPQM assesses pairing quality by analyzing the needs of refugees and provinces, using an exponential utility function based on Manhattan distance for compatibility.
    3. OFCM ensures stable and balanced pairings by applying the Gale–Shapley algorithm, where refugees propose and provinces respond. It evaluates overall fitness to support long-term integration and system stability. 

    To ensure consistent comparisons between the attributes of refugees and the host province for each pair, the model first normalizes the data. Specifically, it normalizes the ability to find work and social housing ratio as follows kx100   where kx is the value of the attribute x . For financial support, the Sigmoid is applied as shown below: 

                                                    xsigmoid = 11+e-(kx-)                                                                  (1)

    Where μ represents the mean of the dataset, and σ represents the standard deviation of the dataset.   

    Then, the model measured the degree of difference between the characteristics of refugees and host provinces by Manhattan formula:

    dManhattan(A,B)=x = attributewx.|ax – bx|                                        (2)

    Where A,B are the points needed to calculate the Manhattan distance and ax, bx is the attribute value of points A or B. After applying the data standardization steps with (1), (2), the degree of difference d(ri , pj) for both sides is divided as follows:          

    dno-norm(ri, pj)=wQL.|riQL – pjQL|+wHN.|riHN – pjHN|   (3) dlinear (ri, pj)=wH.|riH100 -pjH100|+wJE.|riJE100 – pjJE100|   (4)

    dsigmoid (ri, pj)=wFS.|11+e-(riFS-) -11+e-(pjFS-)|     (5)

    Finally, the total degree of difference between refugee ​and province is calculated as the sum of the three components:

    d(ri , pj) =dno-norm(ri, pj) +dlinear (ri, pj) +dsigmoid (ri, pj)   (6)

    Where: wx is the weight representing the priority of the refugee or the receiving province in the matching process.  These weights satisfy: x =1wx = 10 and wx 0, x                                                 

    The weights can be adjusted based on the priorities of the refugees wi or the host province wi, corresponding to dr(ri , pj) and dp(ri , pj), respectively.

    Following the computation of differences, the MPQM model evaluates the overall quality of each refugee–province pair. The pairing quality Q(ri , pj)takes into account both sides’ satisfaction and is defined as:

    Q(ri , pj)= .Sr(ri , pj) + .Sp(ri , pj)                          (7)                          

    Where: 

    Sr(ri , pj): The level of satisfaction ri when matched pj is calculated as: 

    Sr(ri , pj)=1- dr(ri , pj)max  dr(ri , pj) + e                                           (8)

    Sp(ri , pj): The level of satisfaction pj when matched ri is computed as: 

    Sp(ri , pj)=1-dp(ri , pj)max  dp(ri , pj) + e                                           (9)

    , : The weight reflects the priority level of each party, with +=1 

    Accordingly, the satisfaction of each party is calculated using the difference level measured in RPCM. These values reflect the quality of the match, with higher values indicating closer matches and lower values indicating less suitable pairings. 

    Finally, the f() metric in the OFCM model computes the mean satisfaction scores to assess the effectiveness of the allocation strategy. This function combines the satisfaction scores derived from the MPQM model.

                                                            f()=1ni =1nQ(ri , pj)                                                  (10) 

    where n is the total number of refugees. This formula determines the optimal refugee allocation by maximizing overall satisfaction.

    The flowchart below outlines the process of allocating refugees (R) to provinces (P) using three interconnected models: RPCM, MPQM, and OFCM. It begins with input data (R and P), which is processed through RPCM to normalize characteristics, calculate the difference d(ri , pj) using Manhattan distance, and optimize these differences with OMOPSO. The optimized d(ri , pj) is then fed into MPQM, which calculates the pair quality Q(ri, pj) based on satisfaction levels of both refugees and provinces. Finally, OFCM uses Q(ri, pj) to perform stable matching via Gale-Shapley and evaluate the overall fitness, producing an optimal allocation of refugees to provinces.

    Figure 7: The process flow of  RAOI model interconnection

    The RPCM, MPQM, and OFCM models offer a structured, quantifiable approach to refugee-province matching by measuring compatibility and satisfaction. RPCM normalizes diverse attributes and applies Manhattan distance for fair comparison.  MPQM incorporates both sides’ satisfaction for balanced pairing, while OFCM aggregates these scores to evaluate overall allocation quality. Computationally, these models are efficient and scalable due to normalization and distance-based calculations.  However, their reliance on static weights and fixed inputs limits adaptability in dynamic contexts. To address this, the next section introduces OMOPSO—a dynamic, multi-objective approach that refines preferences and enhances matching stability under changing priorities and constraints.

    3.3 Algorithm 

    NP-hard problems are inherently difficult to solve efficiently, not solvable in polynomial time, and thus must be approached through approximation or heuristic methods [35]. The RAOI problem falls into this category due to two key challenges: the exponential growth of possible refugee-province pairings ri,pj as the size of R and P increases, making exhaustive evaluation impractical, and the instability caused by the presence of blocking pairs. Therefore, this study joined SMT and the OMOPSO algorithm to effectively tackle the complexity of the RAOI problem. OMOPSO employed Pareto principles to balance trade-offs, then the Gale-Shapley algorithm from SMT ensured a stable matching by systematically eliminating blocking pairs, assuming the input preferences were complete and consistent.

    To be more precise, the primary purpose of the Gale-Shapley algorithm in our study is to operate within the OFCM model, immediately after the results from the MPQM model are collected, in order to prevent blocking pairs. It operates interactively where ri propose to pj in order of preference, and pj accept or reject based on their preference lists and capacity. Particularly, the algorithm’s effectiveness depends on the construction of priority lists for both parties, which are quantitatively modeled based on the attributes presented in Table 8. From the refugee’s perspective, the priority score for province pj is determined by the function sri,pj=w1pjQL+w2pjFS+w3pjHN+w4riH-pjH, which reflects factors like quality of life, financial support, health system and housing compatibility. Conversely, each province evaluates refugee candidates based on the scoring function spj,ri=w5riEA+w6riHN-w7max0, riFS-pjFS, which indicates quality of life, financial support and health. This process repeats until no blocking pairs remain, ensuring that the final pairings are stable and optimal for both parties.

    The study integrates the OMOPSO algorithm with the Gale-Shapley algorithm to tackle the RAOI problem, which seeks to optimize the allocation of refugees (R) to provinces (P) based on quality and stability. OMOPSO conducts multi-objective optimization, exploring a vast solution space to identify optimal refugee-province matches (ri, pj) while adhering to capacity constraints. However, to guarantee the elimination of blocking pairs, where ri and pj mutually prefer each other over their current matches, the Gale-Shapley algorithm is subsequently employed. This algorithm utilizes preference lists derived from Q(ri, pj), enabling refugees to propose to provinces in order of preference, while provinces accept or reject proposals based on their own evaluations, thereby ensuring stable outcomes.

    In the dimensions of the RAOI, chromosomes are candidate solutions that represent encodings for allocating refugees to provinces. Each chromosome is represented as [a, b, c], where:

    • a, b, c are the numbers of people to be allocated to 3 different provinces
    • Satisfy the constraint: a + b + c = 10 (total number of people to be allocated)

    In Figure 10, chromosome [1, 6, 3] represents the solution to allocate 1 person to location 1, 6 people to location 2,  3 people to location 3.

    Figure 8: Visual representation of a chromosome

    The algorithm begins by randomly generating an initial population of chromosomes that satisfy the total allocation constraint. During each iteration, chromosomes are evaluated using a fitness function (see Equation 9), and the best-performing individuals are selected as pBest/gBest to guide the velocity update. Then, the mutation operator is performed to create diversity, with an automatic adjustment mechanism to ensure that the total number of people is always 10. The best chromosomes are stored in the Pareto archive if they are non-dominated, meaning none of them is strictly better than another in all objectives.

    Figure 9: The process of chromosome

    In order to facilitate comprehension, our research proposes a flowchart illustrating the step-by-step application of OMOPSO and Gale-Shapley algorithm to solve the refugee allocation problem. 

    Figure 10: The flowchart of OMOPSO and Gale-Shapley integration for RAOI.

    The process begins with collecting input information from the characteristics of refugees R={r1,…,rN} and provinces P={p1,…,pM} and then initializing the population of chromosomes, where each chromosome is a vector representing the number of refugees allocated to each province. Next, the OMOPSO algorithm evaluates the suitability of each chromosome. It stores the non-dominated solutions in the repository and updates velocity and position parameters through iterations to enhance solution quality. Once no further improvement is observed, the system passes the best solutions to the Gale-Shapley algorithm. The Gale-Shapley algorithm, using preference lists constructed based on the attributes of refugees and provinces, generates a stable matched set by eliminating blocking pairs. Finally, the system then verifies the stability of the allocation, looping back to initialization if unstable, before displaying the final output.

    To effectively address the refugee-province allocation problem, a hybrid algorithm combining OMOPSO and Gale-Shapley is used. The OMOPSO algorithm begins by initializing a swarm of particles representing potential refugee-province matchings (line 1). Each particle’s fitness is evaluated using function F(S(ri, pj)) (line 1),  and both personal and global bests are updated accordingly (lines 12–15). The positions and velocities of particles are then adjusted (lines 17–18) to explore better solutions.

    Figure 11: Pseudocode for optimal matching using OMOPSO and Gale-Shapley 

    The Gale-Shapley algorithm complements this by ensuring stability in matchings (line 06). Refugees propose to provinces following preference order (lines 07–09), and provinces accept or reject based on their own preferences. This two-phase optimization ensures both quality and stability in the final assignments.

    IV. Result

    The experiment evaluated the effectiveness of the GS algorithm combined with OMOPSO in balancing solution diversity and optimization performance. The server configuration utilized for this problem possesses the following technical specifications: Microsoft’s Windows 11 as operating system, powered by an 11th Gen Intel® Core™ i5-1135G7 processor (2.40GHz, 4 physical cores, 8 logical threads) and equipped with total memory 7.7 GiB. The parameters of the algorithms are presented below:

    Algorithm ParameterPopulation sizeNumber of generations Max time (s)Crossover rateMutation rateDistributed cores
    Value100500600.90.1All cores

    Table 5: The table of input algorithm parameters.

    Subsequently, we introduce a tabular dataset detailing 10 characteristics of 4,400 refugees and 44 provinces, with edge weights in the range [1;10]. This dataset is partially inspired by and calibrated using publicly available statistics from the IIED report on Syrian refugees in Jordan, which includes demographic and socio-economic indicators relevant to refugee-host integration [1]. Although the complete micro-level data were not accessible, we reconstructed key variables such as quality of life, related financial/employment factors based on aggregated values and reported distributions. Each entity lists requirements (req) with corresponding weights (w), reflecting the importance of each preference or constraint. A higher weight indicates that the corresponding requirement is more critical in the entity’s evaluation process. Additionally, properties (pro) represent quantifiable attributes or features that are essential in the matching process. 

    by “req-w-pro 0 to 10.req-w-propreferences

    r1r2r3p1p2p3
    Quality of Life0.36-5-00.34-3-00.79-6-00-0-0.890-0-0.90-0-0.59
    Ability to obtain employment0.86-5-00.76-10-00.37-1-0  0-0-0.620-0-0.350-0-0.93
    Social housing ratio0.24-3-00.41-7-00.11-6-00-0-0.50-0-0.160-0-0.01
    Expected financial support0.88-9-00.05-9-00.5-6-00-0-0.890-0-0.030-0-0.64
    Health status0.19-2-00.96-7-00.67-2-00-0-0.210-0-0.720-0-0.56
    Quality of Life0-0-0.570-0-0.60-0-0.510.73-6-00.94-1-00.96-9-0
    Labor Market Capacity0-0-0.140-0-0.40-0-0.230.21-7-00.42-4-00.69-1-0
    Social housing ratio0-0-0.70-0-0.640-0-0.560.3-4-00.81-8-00.47-7-0
    Financial support0-0-0.190-0-0.960-0-0.770.05-6-00.85-3-00.18-3-0
    Health status0-0-0.930-0-0.380-0-0.820.94-1-00.06-2-00.31-1-0

    Table 6: Sample dataset of refugees and provinces

    With the above dataset, this section presents a clearer overview of the empirical results by summarizing the main aspects through a system of tables and illustrative diagrams. We applied 8 algorithms (OMOPSO, NSGA-II, NSGA-III, eMOEA, PESA2, VEGA, IBEA, SMPSO) to help determine which algorithm performs best on the dataset of 4400 individuals.

    No.eMOEAVEGANSGAIINSGAIIISMPSOIBEAPESA2OMOPSO
    124523527162035719837371533609315827288762399225
    2252751269890355104376087336088315570297251403444
    3248562271192360293376620331276318205295950395753
    4254719268316353173377986336835316393288967397877
    5248606275957352573377645337485311529290418395542
    6254287267906353754376669339403312713289194396844
    7254552269097353448383403338620317246287872396046
    8248047267578356551374219330869314556297352404504
    9252586268107352385374943334753317098295112396214
    10252470271452361679383558335505314681293705397944

    Table 7: Fitness evaluation of eight genetic algorithms

    These algorithms belong to different groups, such as multi-objective optimization based on search methods (OMOPSO and NSGA-III), simple evolutionary algorithms VEGA, partitioning algorithms PESA2, and index-based algorithms IBEA. This difference facilitates comparison from multiple perspectives, particularly in terms of fitness and running time, which helped determine the optimal algorithm in this case (OMOPSO or NSGAIII). However, the choice of OMOPSO [36] for solving the allocation problem is supported by the results in Table 7, where it consistently achieved the highest fitness values across most test cases, demonstrating its superior solution quality in practice.

    1. Iteration 1       b) Iteration 2

        c) Iteration 3       d) Iteration 4

    Figure 12: Comparison of 4400 individuals’ runtimes (in seconds) for the 8 algorithms

    The figure presents the runtime comparison of eight algorithms across four distinct iterations. As illustrated, OMOPSO consistently maintains low and stable execution times relative to other methods, with negligible fluctuations between runs. In iterations 1 to 3, while algorithms such as VEGA and NSGAII show significant spikes in runtime, OMOPSO remains under 15 across all cases. In iteration 4, where overall runtimes drop, OMOPSO continues to perform efficiently and consistently. PESA2 [37], with a moderate fitness, demonstrated a good exploration/exploitation balance, while eMOEA [38] and IBEA [39] offered faster runtimes but lower fitness values, making them appropriate for speed-sensitive scenarios. In contrast, VEGA [40] and NSGA-III [41] showed weaker performance, reinforcing OMOPSO’s advantage across accuracy and efficiency. OMOPSO also outperformed NSGA-II [42] and SMPSO [43] in fitness and runtime balance, demonstrating its robustness against diverse algorithmic strategies. These results demonstrate that OMOPSO offers both computational efficiency and stability, making it the most suitable choice for the refugee allocation problem. To further illustrate the outcomes, figure 13 below depicts refugee satisfaction levels across different provinces.

    Figure 13:  Matching results between refugees and provinces

    OPSO, NSGA-II, across 44 provinces,selection of these 44 nd SMP. selec

    Figure 13 illustrates that OMOPSO maintains stable satisfaction levels across provinces and iterations, demonstrating both solution quality and algorithmic robustness. OMOPSO achieves the highest fitness (403,444) with a competitive runtime (13.61 s), confirming its suitability for large-scale and accuracy-sensitive problems such as refugee resettlement. SMPSO (392,723) and NSGA-III (392,263) also perform well in terms of fitness but show greater variability in runtime. NSGA-II attains a fitness of 370,540; however, its prolonged and unstable runtimes limit its practical applicability. In contrast, PESA2 and IBEA yield moderate performance, while eMOEA and VEGA are faster but produce significantly lower fitness outcomes. Overall, OMOPSO presents the best balance of accuracy, runtime efficiency, and consistency, making it the most suitable algorithm for refugee allocation optimization.

    V. Discussion

    The experimental results demonstrate OMOPSO’s superior performance, achieving the highest average fitness score (404504) and the fastest average runtime (14.10s), significantly outperforming baseline algorithms like eMOEA and VEGA (Table 7). Compared to NSGA-II and NSGA-III, OMOPSO balances solution quality and efficiency better, due to its swarm-based design. These findings align with Kachitvichyanukul et al., who highlighted PSO’s advantages in convergence and diversity over traditional genetic approaches [13]. Unlike prior studies that separated fairness and stability in refugee matching, our experiment integrates both: OMOPSO optimizes conflicting multi-objective criteria, while Gale-Shapley ensures stable pairings. This hybrid framework comprising RPCM, MPQM, and OFCM extends Andersson et al. by adding Pareto efficiency [27] and advances Aziz et al. by embedding evolutionary optimization into a scalable, unified system [28]. However, this study is limited by the use of static input data and fixed priority weights, which may not reflect dynamic refugee or regional changes. Future research should focus on real-time adaptive models that incorporate live data streams and machine-learned weight adjustments to enhance decision-making responsiveness and realism.

    VI. Conclusion

    The uneven distribution of refugees among provinces in the Middle East has caused economic imbalances, social instability, and resource overload in certain regions, making the resettlement of refugees an urgent issue. To address this problem, our study proposed a two-phase approach combining OMOPSO and SMT. OMOPSO was applied to navigate complex multi-objective constraints, identifying feasible allocation scenarios, while SMT, specifically the Gale-Shapley algorithm, was used to ensure stable pairings based on individual preferences. Besides, a major contribution of this research is the design of a hybrid model that optimizes refugee allocation fairly and stably. It enhances matching efficiency while aligning refugee needs with provincial capacities. Accordingly, our approach was validated through a simulated refugee allocation scenario, confirming the effectiveness of combining OMOPSO and Gale-Shapley in achieving high satisfaction. Compared to eight other algorithms, OMOPSO showed the best balance of fitness and runtime, highlighting its efficiency and robustness for solving RAOI.  Ultimately, this research contributes to the field of fairer refugee distribution strategies and facilitates policymakers and humanitarian organizations to gain valuable insights, supporting sustainable regional development. 

    References

    [1] A. H. Salam, P. Garcia Amado, and A.-B. Yamen, “Syrian refugees in Jordan”, Sep. 2024. Available: https://www.iied.org/22486iied

    [2] G. T. Maria and A. Dana, “Understanding Syrian migration in Lebanon: a methodological framework”. European Commission, Sep. 06, 2023. DOI:10.12688/openreseurope.16261.1 

    [3] F. Muath, “Mafraq educators pin hopes on donors to ease pressure off refugee-burdened school system”. The Jordan Times, Mar. 30, 2016 Available: https://www.jordantimes.com/news/local/mafraq-educators-pin-hopes-donors-ease-pressure-refugee-burdened-school-system 

    [4] E. Balla, “The European Union’s Response to the Syrian Refugee Crisis”. E-International Relations, 2023. Available: https://www.e-ir.info/pdf/101195 

    [5]  D. Brown, M. Morris, and L. Thompson, “Urban protracted displacement and displacement economies”. Environment and Urbanization, vol. 36, no. 1, pp. 123–140, Apr. 2024, DOI: 10.1177/09562478241277087 

    [6] G. Honein-AbouHaidar, L. Bou-Karroum, S. E. Parkinson, et al., “Integrating Syrian refugees into Lebanon’s healthcare system 2011–2022: a mixed-method study”. Confl. Health, vol. 18, Suppl. 1, p. 43, 2024. DOI: 10.1186/s13031-024-00600-w 

    [7] I. Y. Addo and A. Tanle, “Rethinking solutions for protracted refugee situation: A case study of the Buduburam refugee camp closure in Ghana”. Scientific African, Jun. 7, 2023. DOI: 10.1016/j.sciaf.2023.e01746 

    [8] P. Biró, “The stable matching problem and its generalizations: an algorithmic and game theoretical approach”. Available: https://www.cs.bme.hu/~pbiro/biro_dissertation.pdf 

    [9] T. Ekim, “The Nobel Prize in Economic Sciences 2012 and Matching Theory”. Science And Technology Publications, 2020. DOI: 10.5220/0009459600050016

    [10] D. Gale and L. S. Shapley, “College Admissions and the Stability of Marriage”. Math. Assoc. Am., Jan. 1962. DOI: 10.1080/00029890.1962.11989827

    [11] A. Teytelboym, D. Delacretaz, and S. D. Kominers, “Matching Mechanisms for Refugee Resettlement”, Sep. 21, 2020. DOI: 10.1257/aer.20210096

    [12] J. Zhang, J. Cao, F. Zhao et al., “A constrained multi-objective optimization algorithm with two cooperative populations”. Memet. Comput., vol. 14, pp. 95–113, 2022. DOI: 10.1007/s12293-022-00360-1

    [13] M. Arjmand, A. A. Najafi, and M. Ebrahimzadeh, “Evolutionary algorithms for multi-objective stochastic resource availability cost problem”. OPSEARCH, vol. 57, pp. 935–985, 2020. DOI: 10.1007/s12597-020-00447-8

    [14] D.-X. Liu, Y.-R. Gu, C. Qian, X. Mu, and K. Tang, “Migrant resettlement by evolutionary multiobjective optimization”. IEEE Trans. Artif. Intell., vol. 6, no. 1, pp. 51–65, 2024. DOI: 10.1109/TAI.2024.3443790

    [15] A. Rajani, D. Kumar, and V. Kumar, “Impact of controlling parameters on the performance of MOPSO algorithm”. Procedia Comput. Sci., vol. 167, pp. 2132–2139, 2020. DOI: 10.1016/j.procs.2020.03.261

    [16] Y. Liu, Y. Li, and D. Huang, “A multiobjective optimization model for continuous allocation of emergency rescue materials”. Math. Probl. Eng., vol. 2020, Article ID 5693182, 2020. DOI: 10.1155/2020/5693182

    [17] A. Garces-Jimenez, J. M. Gómez, N. Gallego-Salvador, and A. J. García-Tejedor, “Genetic and swarm algorithms for optimizing the control of building HVAC systems using real data: A comparative study”. Mathematics, vol. 9, no. 18, Art. no. 2181, 2021. DOI: 10.3390/math9182181

    [18] M. Hagen, “Refugee relocation: A mechanism design approach”.  The Economic Journal, Volume 134, Issue 663, October 2024, Pages 3027–3046. DOI: 10.1093/ej/ueae028 

    [19] J. D. Armas, V. Bélanger, G. Laporte, and M. Rancourt, “Optimizing the assignment decisions in the refugee resettlement process”.  International Transactions in Operational Research, Mar. 2025. DOI:10.1111/itor.70017

    [20] M. Janmyr and D. Stevens, “Regional Refugee Regimes: Middle East”, 2020. DOI:10.13140/RG.2.2.31446.06723.

    [21] D. Nandy, “The Representation of Refugees in the Media of the Middle East and Europe: A Comparative Study. In Nasir Uddin and Delaware Arif (eds.)”. Refugees and the Media: Local and Global Perspectives, Palgrave Macmillan, Gewerbestrasse, pp.115-136, 2024. DOI:10.1007/978-3-031-46514-7_7.

    [22] A. Almohamed, D. Vyas, and R. Talhouk, “Towards a Conceptual Framework for Understanding the Challenges in Refugee Re-settlement”. Proc. ACM Hum.-Comput. Interact., vol. 6, pp. 1-27, 2022. DOI: 10.1145/3492856 

    [23] J. Klugman, E. Ortiz, and A. H. Rubin, “Key Challenges for Refugee Policies and Programs: A Gender Perspective”. World Bank, 2022. Available: https://documents1.worldbank.org/curated/en/447911643215960323/pdf/Key-Challenges-for-Refugee-Policies-and-Programs-A-Gender-Perspective.pdf

    [24] O. El-Abed, M. Hoshmand, F. al Hamouri, and W. Najdi, “Refugee communities mobilising in the Middle East: Refugee-led organisations in Jordan, Lebanon, and Turkey.”, Apr. 2023. Available: https://lebanesestudies.com/wp-content/uploads/2023/07/LERRN_RLO_Study_Middle_East_Final_Report_may_16.pdf

    [25] L. Álvarez, “Two effective solutions from matching theory”. Lund University, Jun. 2018. Available:https://lup.lub.lu.se/luur/download?func=downloadFile&recordOId=8949111&fileOId=8949121

    [26] K. Bansak and E. Paulson, “Outcome-driven dynamic refugee assignment with allocation balancing”. arXiv:2007.03069v5 [math.OC], May. 2024. DOI:10.1287/opre.2022.0445

    [27] P. Xepapadeas and I. Mourtos, “Refugee allocation mechanisms: theory and applications for the European Union”. Social Science Research Network (SSRN), Feb. 2021, DOI: 10.2139/ssrn.3812993

    [28] H. Aziz, J. Chen, S. Gaspers, and Z. Sun, “Stability and Pareto optimality in refugee allocation matchings”. Proceedings of AAMAS 2018, Stockholm, Sweden, 10–15, Jul.  2018. Pages 964 – 972. DOI: 10.5555/3237383.3237842

    [29] A. Teytelboym and W. Jones, “Matching systems for refugees”. Journal on Migration and Human Security, 2017. Available: https://pure.royalholloway.ac.uk/ws/files/28543847/103_353_1_PB.pdf

    [30] B. Cilali, K. Barker, and D. G. Andrés, “A location optimization approach to refugee resettlement decision-making”. Sustainable Cities and Society, 2021. DOI: 10.1016/j.scs.2021.103153

    [31] N. Ahani, P. Gölz, A. D. Procaccia, A. Teytelboym, and A. C. Trapp, “Dynamic placement in refugee resettlement”. Operations Research, vol. 72, no. 3, pp. 1087–1104, Jul. 18, 2021. DOI: 10.1287/opre.2021.0534

    [32] D. Delacrétaz, S. Duke Kominers, and A. Teytelboym, “Matching mechanisms for refugee resettlement”. American Economic Review 113 (10): 2689–2717, 2023. DOI: 10.1257/aer.20210096

    [33] M. Delorme, S. García, J. Gondzio, J. Kalcsics, D. Manlove, and W. Pettersson, “Mathematical models for stable matching problems with ties and incomplete lists”. European Journal of Operational Research, vol. 277, no. 2, pp. 426–441, Sep. 2019. DOI: 10.1016/j.ejor.2019.03.017

    [34] Z. Yu, K. Wang, S. Xie, Y. Zhong, and Z. Lv, “Prototypical network based on Manhattan distance”. Computer Modeling in Engineering & Sciences, vol. 131, no. 2, pp. 1–21, Mar. 2022. DOI: 10.32604/cmes.2022.019612

    [35] S. K. Saini, “A study and explore the significance of NP Hard and Soft Problem”. Journal of Emerging Technologies and Innovative Research, vol.10, Issue 3, Mar. 2023. ISSN-2349-5162

    [36] J. Zhang, L. Wang, and Y. Chen, “A comprehensive review of particle swarm optimization”. J. Zhejiang Univ. Sci. C, May. 2024, DOI:10.4028/www.scientific.net/JERA.23.141

    [37] H. Jain and K. Deb, “An evolutionary many-objective optimization algorithm using a reference-direction-based non-dominated sorting approach, Part II: Handling preferences and extensions”. IEEE Trans. Evol. Comput., vol. 22, no. 6, pp. 960–984, Dec. 2018. DOI:10.1109/TEVC.2013.2281535

    [38] X. Wang, F. Zhang, and M. Yao, “A many-objective evolutionary algorithm with metric-based reference vector adjustment”. Complex Intell. Syst., vol. 10, pp. 207–231, 2024, DOI: 10.1007/s40747-023-01161-w

    [39] K. Pereverdieva, A. Deutz, T. Ezendam, T. Bäck, H. Hofmeyer, and M. T. M. Emmerich, “A comparative analysis of indicators for multiobjective diversity optimization”. arXiv preprint, Oct. 2024. DOI: 10.48550/arXiv.2410.18900

    [40] T. Andersson, L. Ehlers, and A. Martinello, “Dynamic refugee matching”. Lund Univ. Working Paper, Mar. 2018. Available: https://www.econstor.eu/bitstream/10419/260236/1/wp2018-007.pdf

    [41] H. Wang, L. Chen, and Y. Zhang, “An improved NSGA-III algorithm with adaptive reference point adjustment for many-objective optimization”. Appl. Soft Comput., vol. 138, p. 110567, 2023, DOI: 10.1016/j.asoc.2023.110567

    [42] P. Kumar, S. Roy, and N. Gupta, “A modified NSGA-II algorithm with adaptive mutation strategy for many-objective optimization”. Appl. Soft Comput., vol. 115, p. 108204, 2023, DOI: 10.1016/j.asoc.2021.108204

    [43] T. Ling, Z. H. Zhan, Y. X. Wang, Z. J. Wang, W. J. Yu, and J. Zhang, “Competitive swarm optimizer with dynamic grouping for large scale optimization”. Proc. IEEE Congr. Evol. Comput. (CEC), 2018, pp. 1–8, DOI: 10.1109/CEC.2018.8477971

  • Enhancing Recruitment Efficiency: Leveraging Stable Matching Theory with NSGA-III and Gale-Shapley Algorithms for Optimal Employer-Intern Pairing

    Enhancing Recruitment Efficiency: Leveraging Stable Matching Theory with NSGA-III and Gale-Shapley Algorithms for Optimal Employer-Intern Pairing

    Nguyễn Thành Đạt (2201040040) | Nguyễn Kim Ngân (2201040125)| Nguyễn Quang Anh (2301040007) | Tạ Quang Trung (2101040199) | Nguyễn Thiện Hiếu (2301040071) | Nguyễn Ngọc Linh (2201040099)|Bùi Thái Bảo(2201040016)|Lê Văn Dương (2201040035) 

    Abstract

    Internships have become a crucial part of the modern labor market, yet the recruitment process is hindered by mismatches and inefficiencies in identifying suitable interns. These issues are believed to be an obstacle for interns’ career growth, while employers miss the opportunity to harness potential interns. To address these problems, our paper employs Stable matching theory to ensure mutually optimal matches by aligning employer and intern preferences, eliminating unstable pairings where either party prefers another match. This research improves internship recruitment by minimizing mismatches, leading to more effective hiring and better workforce integration. By integrating NSGA-III for multi-objective optimization, this research ensures stable and efficient employer-intern pairings, significantly enhancing recruitment processes and match quality. This approach combines the Gale-Shapley algorithm to ensure stable matches while leveraging NSGA-III to diversify input configurations, overcoming limitations of Gale-Shapley and optimized multi-objective pairings between interns and employers.

    Keywords: Intern-Employer Matching, Matching Optimization, Stable matching theory, NSGA-III and Gale-Shapley algorithm.

    1. Introduction 

    1.1 Background.

    In recruitment processes, a common challenge is the mismatch between interns’ expectations and employers’ requirements. Poor leadership and working conditions reduce satisfaction and increase turnover [1]. Mahesh notes that the lack of soft skills of the internship candidates, such as communication, reduces the employability [2]. Figure 1 shows matched jobs yield higher graduate wages.

    Figure 1: Pen’s Parade (Quantile Function) for Wage Income per Graduate [3]

    A low wage might reduce excitement and severely affect performance [4]. Lack of work discipline and limited experience pose significant challenges to task completion, often leading to missed deadlines and decreased efficiency among interns [5]. For companies and organizations, assigning interns to unsuitable roles not only hampers work efficiency but also disrupts overall productivity. This mismatch results in considerable financial losses and resource drain due to the costs of onboarding and training interns who may not be a good fit, ultimately leading to wasted time, effort, and money [6].

    Several strategic conflicts arise during the matching process that must be carefully navigated. Employers prioritize responsibility, adaptability, and growth potential [7], while interns seek flexible hours, training, and advancement [8]. These mismatches hinder recruitment and reduce intern satisfaction. Figure 2 highlights talent shortage disparities, including skill and expectation mismatches.

    Figure 2: Discrepancy Between Employers’ and Students’ Expectations on Key Hiring Criteria [9].

    Balancing these interests are essential not only for providing interns with practical learning experiences, skill development, and networking opportunities but also for helping industries lower recruitment costs, access affordable labor, and foster relationships with academic institutions while training future talent [10].

    The Stable matching theory, a key concept in mathematics and economics, plays an important role in solving preference-based matching problems in recruitment. This theory, recognized through the Nobel Prize awarded to Roth and Shapley in 2012, addresses how to pair two groups [11]. In this research, the Gale-Shapley algorithm is applied to match employers and interns, systematically modeling recruitment as a preference-driven process that reduces dissatisfaction and turnover [12]. This method is chosen over others because it offers a systematic and robust solution to complex, preference-based matching problems [13]. Unlike other methods, such as random matching or simple ranking, the Gale-Shapley algorithm accounts for the nuanced preferences of both sides, ensuring that each match is stable and less likely to be disrupted by conflicting interests [14].

    Our research integrates the Gale-Shapley algorithm with NSGA-III, a Multi-Objective Evolutionary Algorithm (MOEA), to optimize job matching by handling high-dimensional problems better than NSGA-II [15]. NSGA-III uses non-dominated sorting to rank solutions, ensuring optimal trade-offs between employer and intern preferences, while maintaining diversity through reference point association [16]. This approach effectively addresses conflicting objectives in job matching [17].

    1.2 Related work

    Recent studies have focused on improving recruitment and job-matching through algorithmic solutions. Traditional methods, like ranking and random matching, simplify the process but often overlook the complex needs of both employers and interns, leading to mismatches and dissatisfaction. As a result, research has shifted toward addressing these complexities for better recruitment outcomes.

    Yang, H. applied the stable matching algorithm to optimize resource allocation in the decentralized AM sharing economy, showing its superiority over MILP and FCFS in balancing demand-supply scenarios [18]. Yang, D. also explored optimization through a multi-objective model for the flexible job shop scheduling problem (FJSP), minimizing the makespan and energy consumption [19]. The comparison between NSGA-II and MOEA/D solvers demonstrated that NSGA-II provided better real-world solutions.

    In the field of internship and job matching, Sawadsitang et al. developed an interview matching framework to optimize internship allocations, validated with real and synthetic data [20]. Zakrzewska proposed a modified Gale–Shapley algorithm to improve the assignment process of Polish pupils to schools, enhancing fairness and allocation efficiency [21]. Building on these frameworks, Ibrahim et al. and Soni explored advanced algorithms to refine matching processes [7, 22]. Ibrahim’s research employed fuzzy logic for internship placement, while Soni focused on AI’s role in recruitment, emphasizing fairness and efficiency. These studies provided key insights into improving placement processes and addressing biases in matching systems [7, 22].

    Elgammal streamlined job-hunting by automating resume screening and job recommendations, reducing costs and enhancing satisfaction [23]. Meanwhile, Huang et al. applied the Gale–Shapley algorithm to allocate healthcare resources to the elderly, demonstrating its effectiveness in real-world stable matching scenarios [24]. Mendoza discussed challenges in distinguishing required versus desired skills in recruitment [25]. Yue Wu et al. analyzed modifications to the Gale-Shapley algorithm to address imbalances in residency matching, ensuring stable matches and enhancing hiring stability [26].

    Ugale et al solved a problem related to recommending appropriate jobs to job-seekers by matching semi-structured resumes with job descriptions [27]. The performance of their approach was compared to six other models (Table 1), revealing that efficiency increased by understanding each algorithm’s strengths and weaknesses and combining the use of two or more algorithms in parallel in one mode.

    Table 1: Outcomes comparison with different models [27].

    ModelWord n-gramBOWTF-IDFBag of MeansDoc2VecCNNSiamese adoption of CNN
    Accuracy on test A58.2456.9260.4662.3465.2473.3181.34
    Accuracy on test B59.0157.0661.2363.9267.2474.6883.19

    Pudasaini et al. used word2vec for semantic analysis and the Gale-Shapley algorithm for stable matching between candidates and employers [28]. Similarly, Aziz et al. addressed stable matchings with distributional constraints in a summer internship program, using a Mixed Integer Linear Program (MILP) to find maximum-size matchings [29]. Masood et al. focused on optimizing job scheduling across multiple employers by applying dispatching rules [30]. Building on this, He et al. enhanced the NSGA-III algorithm by improving population diversity and incorporating adaptive local search strategies for better human resource management outcomes [31].

    Table 2: Summary of relevant literature according to the applied methods and approaches.

    ModelProblemsReference
    GSAResource allocation in decentralized systemsH.Yang, 2021
    GSAElderly misplacement in care facilitiesL.Huang, 2024
    Modified GSAUnfair student-school assignmentsZakrzewska, 2024
    Modified GSAMatching with unequal group sizesMendoza, 2022
    Stable matching modelHigh energy use in operationsD.Yang, 2020
    Profile matching modelStudents mismatched to internshipsN.Ibrahim, 2021
    Resume-job matching modelUnstructured resumes hinder matchingUgale, 2025
    Job matching modelIrrelevant job recommendationsElgammal, 2021 
    Interview matching frameworkUnbalanced internship distributionsSawadsitang, 2022
    AI-powered recruitment systemLack of clarity in AI hiringV.Soni, 2024
    Word2vec ModelHard to spot right candidatesPudasaini, 2022
    Graduates’ job matchingMatching issues in complex systemsH. Aziz, 2024
    NSGA-III algorithmConflicting multi-objective tradeoffsY.He, 2023
    D1rules model Inefficient job-machine schedulingA.Masood, 2021

    1.3 Key contributions

    The intern-employer matching process is facing several key challenges, including skill mismatches, differing preferences, and unstable placements. Employers seek specific competencies, while interns prioritize career growth and work environments, making alignment difficult. Ensuring long-term stability is another issue, as initial compatibility doesn’t always lead to lasting success. To address these problems, the study focuses on three questions: 

    1. What are the essential factors for a successful intern-employer matching process?
    2. How can a strategic approach be applied to consider the preferences of both employers and interns while ensuring optimal and stable matches?
    3. How can a strategic approach be applied to generate a set of optimal intern-employer matches?

    The key factors shaping the matching process include skill requirements, career goals, and work environment. Through a review of research papers, we identified additional factors like internship duration and compensation, which are incorporated into the matching model to improve compatibility and alignment. These factors help define the foundation for a balanced and effective matching process.

    Based on these factors, the problem is framed within the stable matching model. Employers and interns are assigned preferences, and the goal is to find a stable match that satisfies both parties’ objectives. This approach ensures that the matching process reflects the priorities and expectations of both sides.

    For efficient multi-objective optimization, we use NSGA-III to enhance match quality across multiple objectives. The Gale-Shapley algorithm, as analyzed by Yue Wu et al., ensures stable matches in residency programs by aligning individual preferences [26].

    Our research contributes to the field of intern recruitment through the creative and flexible use of NSGA-III and Stable matching theory (SMT).These key contributions are: 

    1. Enhance Intern-Employer Matching Process: Our study promotes a balanced and efficient matching system by considering both interns’ aspirations and employers’ requirements in a structured manner. 
    2. Ensure Stability and High-Quality Matches: By incorporating 3 models inspired from other studies, we created a structured matching method that enhances fairness and reliability, creating an optimized recruitment system that consistently delivers high-quality matches.
    3. Develop an Optimization Approach for Multi-Objective Recruitment: Our models allow for balancing multiple objectives, such as employer requirements and intern preferences, improving allocation efficiency and recruitment outcomes.

    Through these contributions, our research aims to collectively enhance the efficiency, fairness, and adaptability of intern recruitment processes.

    1. Problem definition.

    The NSGA-III Based Recruitment Efficiency (NSERE) problem addresses inefficiencies in intern recruitment, such as time waste, mismatches, and reduced productivity. The two parties in NSERE are as follows: 

    1. The list of interns is denoted by I = {i1, .. ,iX}, with ia is the intern at the ath position 0 < a X | X ∈ N+
    2. The list of employers is represented as E = {e1, .. ,eY} where ej is the employer at the jth position 0 < j Y | Y ∈ N+

     Let:

    1. P be the preference list for intern, the set of employers that ia finds acceptable.
    2. Q be the preference list for employer, the set of intern that ej find acceptable.

    Determining characteristics and requirements is crucial to the process of matching employers with interns. Each ej (0j Y) includes a list of employers requirements while an intern ia (0aX) looks for an employer based on their own criteria. Defining that if ia I finding at most m employers ej E acceptable if ej belongs to P , and employer acceptability follows the same principle with Q.

    A matching M(ia, ej) in NSERE is acceptable if each intern ia can prefer at most ne employers, and each employer ej can match with at most ni​ intern. The following requirements of best stable match M have to be covered such that: 

    1. Every intern ia is assigned to several employers, more than one employer ej in matching M, and an employer ej  can be suggested for numerous interns.
    2. We define M(ia, ej) only if ia and ej ​ formed a match in M (i, e M ). There are no blocking pairs(ia, ej) in M where ia would prefer ej over ej​, or ej ​ would prefer i a ​ over ia 

    The matching process adheres to specific constraints, as detailed in the tables below. Table 3 presents a dataset featuring information on three interns i1, i2, i3 and four employers e1, e2, e3,e4, along with their corresponding characteristics and requirements.

    Table 3: Example dataset of intern’s characteristics and employer’s requirements

    InternsEmployers
    No.i1i2i3No.e1e2e3e4
    GPA33.54GPA343.52
    Working hours (per week)153020Working hours (per week)≥ 10≥ 35≥ 25≥ 15
    Expected salary ($)130017001300Salary ($)1700200016001400

    The input for NSERE in both algorithms consists of interns I = {i1, .. ,iX}, and employers E = {e1, .. ,eY}, including their attributes and mutual preferences. Employers specify hiring criteria, while interns have their own selection preferences, derived from relevant literature [32, 33].

    For each employer jth, characteristics are defined as EjAB, where AB indicates the type of requirement, such as:

    • Resume requirements EjR: Includes GPA range a,b, Entrance Exam Scores 0-10, and Recommendation Letters.
    • Personality alignment requirement EjPA: Based on MBTI compatibility with organizational culture and team dynamics.
    • Working hours requirements EjWH: Specifies the minimum required working hours.
    • Duration requirements EjD: Defines the expected internship duration in months. 

    In contrast, the characteristics of the ath intern are defined as IaAB​, where AB denotes specific attributes such as company prestige (CP), work environment (WE), basic salary (BS), and geographical location (GL). Intern preferences include:

    • Company prestige IaCP​: Preference for firms rated 1–5 by Reputation Score (RS), Industry Recognition (IR), and Employee Reviews (ER), i.e., CP = RS, IR, ER.
    • Work environment IaWE​: Rated 1–5, considering Colleague Support (CS), Company Benefits (CB), and Job Security (JS), i.e., WE = CS, CB, JS.
    • Basic salary IaBS​: Minimum expected salary in USD.
    • Geographical location IaGL​: Maximum preferred commute distance, in kilometers.

    Other intern features include resume IaR​, personality alignment IaPA​, work hours IaWH, and internship duration IaD​. Employer attributes include EjCP, EjWE, EjBSand EjGL

    Table 4: Characteristics of employers and interns

    AgentsEmployersInterns

    Characteristics
    Resume requirements EjRCompany prestige requirements IaCP
    Personality alignment requirements EjPABasic salary requirements IaBS
    Work hours requirements EjWHGeographical location requirements IaGL
    Duration requirements EjDWork environment requirements IaWE
    Resume IaRCompany prestige EjCP
    Personality alignment IaPABasic salary EjBS
    Work hours availability IaWHGeographical location EjGL
    Duration IaDWork environment EjWE

    The NSERE model tackles mismatches in intern-employer pairing through a multi-objective, stable matching approach. It balances the differing priorities of both sides—interns consider factors like EjCP, EjBS, EjGL, and EjWE, while employers evaluate IaR, IaPA, IaWH and IaD. By applying weighted preferences, constraint satisfaction, and stability checks, the model ensures optimal, mutually beneficial matches, recruitment efficiency.

    Figure 3: Flow diagram modeling our approach. 

    The flowchart outlines the NSERE matching process, beginning with preference lists and using NSGA-III to optimize matches based on skills, preferences, and job criteria. It applies genetic operations and uses Gale-Shapley to form stable, conflict-free pairings.

    1. Methods

    3.1 Existing model

    In defining the model for optimizing employer-intern matching, several studies influenced our approach to structuring how inputs flow into final pairings. More specifically, Lyu [34] proposed a Stochastic Multi-Objective Optimization Framework (SMOOF) that balances different stakeholders’ priorities. This model incorporates randomness into the optimization process, allowing exploration of multiple feasible solutions.
    The mathematical formulation of SMOOF can be interpreted as following:

    (S0)maxx(ω ){Eω ∼Ψ[f1(x(ω),ω)],Eω ∼Ψ[f2(x(ω),ω)],…Eω ∼Ψ[fk(x(ω),ω)]} (1)

    Where ω denotes a supply-demand scenario drawn from distribution Ψ, and x(ω) the matching solution in scenario ω. The multiple performance metrics are denoted by fk(·), for k = 1, 2,… ,k. The set x(ω) is a convex feasible region associated with the scenario realization , and the maximization is over a vector of performance metrics. By solving this formulation, we balance diverse objectives under uncertainty, making it ideal for real-world matching. Given this insight, our approach extends Stable matching theory with NSGA-III to ensure stable, high-quality employer-intern pairings.

    3.2 Model for NSERE

    Based on the existing models above and established criteria to address the NSERE, three specialized models were developed, each targeting a key dimension of intern-employer matching:

    (i) IECM (Intern-Employer Compatibility Model): Evaluate compatibility based on factors such as EjCP with IaCP, EjBS with IaBS, IaR with EjR, and IaWH and EjWH.

    (ii) OSCM (Overall Similarity Calculation Model): Computes mutual similarity scores using weighted preferences and requirements for a pair of interns and employers to evaluate match quality.

    (iii) FPEM (Fitness and Payoff Evaluation Model): Assesses overall matching fitness and satisfaction across all pairs, ensuring global optimization and match effectiveness

    3.2.1 Intern-Employer Compatibility Model (IECM)

    IECM analyzes the similarity between interns Ia 0 < a X | X ∈ N+ and employers Ej 0 < j Y | Y ∈ N+ based on their attributes and requirements. Similarity is calculated by comparing provided and requested values using specific formulas.

    For interns’ characteristic

    Regarding resume matching, if the intern’s qualifications align with employer’s requirements.

    S(IaR,EjR) = i=13.Wi. Fi (2)

    Where Wi represents the normalized weights for GPA, exam score, recommendation letters. Fi ∈ [0.1] denotes the normalized satisfaction score for each respective criterion. Companies evaluate intern personality alignment with organizational culture using MBTI, scoring each of four dimensions where mi is the dimension’s match score.

    S(IaPA,EjPA) = 14i=14mi (3)

    Working hours and internship duration similarity depends on intern availability versus employer requirements, scoring 1 for a perfect match and less for differences (hours > 0, duration > 1 month).

    S(IaWH,EjWH) = min (1,IWHaEWHj) (4)

    and

    S(IaD,EjD) = min (1,IDaEDj) (5)

    For employers’ characteristics:

    We considered binary 0 or 1, comparability for unique attributes like work environment and company prestige, specifically:

    S(IaWE,EjWE) = 1 if IaWE=EjWE (5)

    S(IaWE,EjWE) = 0 if IaWEEjWE (6)

    and

    S(IaCP,EjCP) = 1 if IaCP=EjCP (6)S(IaCP,EjCP) = 0 if IaCP EjCP (7)

    The similarity value of basic salary is denoted as follows: 

    S(EjBS,IaBS) = EBSjIBSa    if EjBS <  IaBS           (7)

    S(EjBS,IaBS)  = 1        if EjBS >=  IaBS  (8)

    Lastly, we calculate the similarity of geographical location between employers and interns requirement:

    S(EjGL,IaGL ) =ED  AD if ED < AD (8)

    S(EjGL,IaGL ) =1      if ED > AD       (9)

    In which, ED is expected distance from interns (from IaGL to the intern’s residence), while AD represents the actual distance from the intern’s settlement to the company geographical location EjGL.

    3.2.2 Overall Similarity Calculation Model (OSCM)

    OSCM evaluates intern-employer suitability through bidirectional weighted similarity scores: 

    Interns to Employers Similarity IaI={I1,  .. ,IX} and employer EjE={E1, .. ,EY}  

                                          OS(Ia,Ej)=a=1Xj=1Yk=14WkIa. Sk(Iak,Ejk)                                 (10)

    Employer to Intern Similarity:                         

    OS(Ej, Ia)=a=1Xj=1Yk=14WkEj. Sk(Ejk, Iak)                               (11)

    Where:

    WkIa, WkEj: The weight assigned to the 𝑘 k-th attribute from the intern’s and employer’s perspectives, respectively.

    Iak,Ejk: The k-th attribute values of intern Ia and employer Ej.

    Sk(x, y): A similarity function that measures the compatibility between two corresponding attribute values

    3.2.3 Fitness and Payoff Evaluation Model (FPEM)

    FPEM optimizes intern-employer matching by assessing compatibility at individual and group levels, ensuring each intern iaI pairs with at least one suitable employer ejE and vice versa, based on mutual criteria. The total fitness function sums similarity scores for all matched pairs M(ia, ej,):

    f=a=1,j=1COS(ej,ia)+OS(ia,ej) (12)

    The diagram below illustrates the sequential integration of three models in our matching system. First, the IECM calculates basic compatibility scores by comparing intern characteristics with employer requirements across key dimensions like resume quality, personality traits, working hours, and salary expectations. These raw compatibility metrics then flow into the OSCM, where they are weighted according to both parties’ priorities – employers might emphasize resume quality while interns prioritize salary and company prestige. Finally, the FPEM aggregates these weighted scores to evaluate the overall quality of potential matches across all possible pairings.

    Figure 4: Illustration of connection between 3 models

    A novel employer-intern matching model would be introduced by integrating Stable matching theory with NSGA-III and the Gale-Shapley algorithm. Unlike conventional approaches centering on preference rankings, our model treats employers and interns as strategic agents, enabling multi-criteria decision-making. NSGA-III facilitates efficient exploration of large solution spaces, balancing trade-offs among competing objectives to yield high-quality matches. This hybrid approach enhances scalability and realism in recruitment, offering a computationally efficient framework for optimized, strategic pairings.

    3.3 Algorithm

    An NP‑hard problem is one to which every decision problem LNP can be reduced in polynomial time, making it at least as hard as the hardest problems in NP [35]. The NSERE matching problem is considered a NP-hard problem by this definition. With N interns and employers, the number of potential assignments grows exponentially with worst case time complexity O(N!), so verifying a stable match requires exponential effort, and for any NP decision problem L and input x, we can in polynomial time build an NSERE instance f(x) such that:

                xLf(x)                             admits a stable matching

    i.e.  L NP, LPNSERE        hence, NSERE is an NP-hard problem        

    Our approach to this NP-hard problem is combining the Gale-Shapley algorithm ensures stable matchings between interns and employers, while NSGA-III mitigates proposer-optimal bias by generating diverse preferences. 

    The Gale-Shapley algorithm addresses the challenge of matching interns with employers by ensuring stable pairings. It relies on two sets of preference lists: P representing the preferences of the interns and Q representing the preferences of the employers, both defined in the Problem definition section. A matching is stable when no unmatched intern-employer pair (Ia, Ej) prefers each other over their assigned partners. With time complexity O(N2),the algorithm guarantees feasible computation even in large-scale recruitment scenarios. Interns propose to their top-choice employers, and employers tentatively accept the most preferred candidates while rejecting others. This process continues until stable matches are formed.

    While Gale-Shapley effectively ensured stable NSERE matchings, its proposer-optimal bias favored initial preferences. Thus, NSGA-III, an MOEA, was integrated to generate diverse, randomized preference lists mitigating this bias. Gale-Shapley then produced stable matchings. To achieve this, NSGA-III encoded matchings as chromosomes Cr = {cr1, .. ,crn}, linking interns I = {i1, .. ,iX} and employers E = {e1, .. ,eY}. The fitness function (11) f(cr) evaluates these matchings based on factors like resume quality, working hours, and salary. NSGA-III used reference-point-based non-dominated sorting to ensure diverse, well-distributed pairings with complexity O(NlogN, while Gale-Shapley’s complexity was ON2, yielding a combined cost of O(Nlog N+ N2). Key parameters like population size, objectives, edge weights, mutation, and crossover rates, were tuned to enhance diversity and optimize matchings.

    In the employer-intern matching problem, a chromosome (cr) represents a candidate solution encoding potential intern-employer pairs. Each chromosome is a vector where elements correspond to specific pairings. The size of cr, equals the total number of possible pairs M(ia, ej), the payoff values for each pair are calculated using equation (11), measuring mutual compatibility and satisfaction.

    Figure 5: Visualialter, restrict, or revoke access without player consentzation of chromosome

    The fitness function is a key part of the algorithm, evaluating how effective each chromosome is as a potential matching solution. After every mutation stage, chromosomes Cr create offspring O in optimum pairing. Each offspring’s fitness level f(O) can be expressed as equation (11). The top-performing offspring chromosomes, based on f(O), are selected as parents P for the subsequent mutation stage. This iterative assessment ensures each chromosome cri obtains optimal fitness f(cri) in relation to the characteristics and the requirements of both agents.

    Figure 6: The process of selecting pairs of chromosomes.

    The below diagram displays the process flow of the mixed algorithms NSGA-III and Gale-Shapley: alter, restrict, or revoke access without player consent

    Figure 7: The process flow of the algorithm.

    The figure illustrates the integration of NSGA-III and Gale-Shapley for solving the NSERE problem. Intern data I={i1,….,ix} and employer data E={e1,….,ey} are input, and NSGA-III generates preference lists through information exchange, mutation of ixand ey, and fitness evaluation function f. Then Gale-Shapley uses these lists to form stable matches. These matches are evaluated against additional quality criteria, if they fail, the process loops; otherwise, stable matches are output, ensuring efficient and balanced pairing.

    The Pseudo code illustrates a hybrid approach integrating NSGA-III with the Gale-Shapley algorithm to address multi-objective stable matching in the NSERE model. NSGA-III identifies high-quality matchings by optimizing multiple objectives. The Gale-Shapley procedure subsequently ensures stability by aligning outcomes with individual preference rankings.

    Figure 8: Pseudo code for applying NSGA-III and Gale-Shapley algorithms

    NSGA-III explores a diverse solution space through crossover, mutation, and selection guided by performance metrics. The resulting matchings inform the construction of preference lists. These are refined into stable, optimized pairings using the Gale-Shapley algorithm.

    1. Result

    This section shows a comprehensive review of computational experiments to ensure the efficiency and availability of the applied algorithms and functions. The server configuration used to address the problem includes the following technical specifications: Windows 11 operating system powered by a 10th Gen Intel(R) Core(TM) i5-7200U CPU @ 2.50GHz, 8GB RAM, 256GB SSD Storage, and GPU NVIDIA GTX 2050.

    Table 5: The table of experiment parameters.

    Experiment ParametersNumber of generationNumber of characteristicsEdge weightMutation rateCrossover rate
    Value20008[1,10]0.010.8

    Table 5 above summarizes the experimental parameters, which include a population size of 1000 interns and 1000 employers, evolved over 2000 generations. Each agent is assigned 4 characteristics, which pay different attention to each characteristic on a 10-point scale as the edge weight represents. The NSGA-III algorithm was configured with a mutation rate of 0.01 and a crossover rate of 0.8 to ensure a diverse exploration of the solution space.

    In this section, we are proposing a sample data set of two groups: group of 1000 interns I={i1, .. , i1000} and group of 1000 employers E={e1, .. , e1000}, including a part of the dataset collected from Kaggle website with similarity to the characters mentioned in this paper.The table 6 below summarizes two individuals in each group. The table presents each individual’s properties (p), their requirements (req) from the opposite side, and the weight (w) of each requirement (1–10) based on preference. This setup, based on the article by [36], helps standardize compatibility and prioritize key preferences for fair and efficient matching.

    Table 6: The sample dataset of interns and employers

    i1i2e1e2
    IR15.03 – 4 – 24.97 95.66 – 1 – 7.3712.28 – 4 – 93.8775.30 – 9 – 94.8
    IPA63.21- 4 – 68.944.26 – 4 – 31.182.40:53.25 – 1 – 17.155.69 – 8 – 19.61
    IWH60.61 – 2 – 65.0469.13 – 1 – 87.6720.31 – 4 – 53.4792.75 – 3 – 35.87
    ID35.82:59.70 – 9 – 1576.81 – 2 – 17.5128.78 – 7 – 62.1921.2 – 9 – 64.71
    ECP75.86 – 4 – 16.1741.91:80.08 – 6 – 38.83.36 – 9 – 4.639.69:75.21 – 2 – 86
    EBS43.52 – 8 – 29.924.00 – 4 – 32.4496.91 – 7-18.3539.41 – 3 – 20.87
    EGL75.14 – 1 – 76.3672.83 – 4 – 58.7628.52 – 7 – 24.5620.03:56.87 – 3 – 47.19
    EWE46.89 – 4 – 95.1427.16:66.26 – 3 – 97.6580.72 – 6 – 83.5757.62 – 5 -86.08

    Both employers and interns are assessed in these samples based on their individual weights and requirements. While employers consider resume IR, personal alignment IPA, work hours IWH and duration ID, interns prioritize company prestige ECP, basic salary EBS, geographical location EGL and work environment EWE

    Figure 9: Sample of matching result

    Figure 9 illustrates a sample result showing the matches between interns and employers, represented as ix and ey, where x and y are the index of the interns and employers respectively with their satisfaction value.

    Table 7: Comparison experiment including fitness values and runtime across different algorithms on the data set of 2000 individuals

    NSGA IIIeMOEAPESA2VEGA
    1171549.7/5.044168769.3/5.076172950/5.05165070.2/5.043
    2171797.2/5.042168451.5/5.003172815.1/5.023165179.8/5.087
    3170970.5/5.027168501.9/5.011172703.9/5.004166214/5.035
    4171533/5.035169575.6/5.001172686/5.026165898/5.032
    5171300.3/5.022169060/5173084.5/5.017165528.8/5.036
    6172299.5/5.01169019.7/5.009172705.6/5.028165827.1/5.052
    7171790.2/5.013168959.1/5.004173110.3/5.011165613.7/5.06
    8173226.4/5168682.1/5172725.2/5.011165653.2/5.017
    9172605.3/5.026168598.5/5173432.4/5.005167150.8/5.045
    10172142.35.008168790.1/5171833.1/5.005165771.4/5.038

    Table 7 summarizes an experiment on a dataset of 2000 individuals, comparing four algorithms for multi-objective optimization: eMOEA, PESA2, VEGA, and NSGA-III. Each algorithm has unique strengths and approaches. eMOEA uses tabu-based rules to guide solution exploration [37]. PESA2 employs grid-based fitness assignment for environmental selection [38]. VEGA integrates virus populations and infection operators to avoid premature convergence and enhance solution accuracy [39]. NSGA-III excels in many-objective problems, leveraging adaptive reference points to maintain diversity [40]. While NSGA-III excels in complex optimization, comparative benchmarking is essential to rigorously evaluate its robustness and delineate its strengths and limitations in the intern–employer matching context.

    Each cell in table 7 contains a fitness value indicating optimization quality, along with the corresponding runtime. The results show generally stable execution times, while fitness scores exhibit some variability across runs, likely due to stochastic elements in the algorithms. 

    1. Iteration 1

    c. Iteration 3

    1. Iteration 2

    d. Iteration 4

    Figure 10: A comparison of runtime (in seconds) across four generic algorithms of 2000 individuals

    The runtime performance of the four algorithms over the first four iterations is illustrated in Figure 10. Each subfigure shows actual execution times under the same conditions. The data reveals consistent runtimes around 5 seconds, with minimal variation among algorithms and iterations, reflecting stable computational performance.

    1. Fitness score of VEGA algorithm
    1. Fitness score of PESA2 algorithm
    1. Fitness score of NSGAIII algorithm
    1. Fitness score of eMOEA algorithm

    Figure 11: Comparison of fitness score across four generic algorithms after several execution times.

    The variation in fitness scores across the 10 runs for each algorithm is visualized in Figure 11. Each chart includes data points, a linear trendline, and an R² value, highlighting the degree of consistency in optimization performance. These visualizations offer insights into the internal behavior of each algorithm across repeated executions, beyond just average results.

    1. Discussion

    While PESA2 achieved the highest mean fitness-to-time ratio (34.438) with a standard deviation () of 121.8, NSGA-III, with a comparable mean (34.230) and slightly lower variability ( = 121.6), emerges as the preferred algorithm due to its faster average runtime, which enhances its suitability for larger datasets or more complex problems by consistently delivering high-quality results more efficiently; in contrast, eMOEA’s lower mean (33.699) and higher variance ( = 194.3) reflect its limited global exploration, and VEGA’s weakest performance (mean = 32.867, = 200.7) stems from its simplistic, non-elitist selection mechanism, ultimately reinforcing NSGA-III’s balanced advantage in both efficiency and reliability.

    This study improves the intern-employer matching process by integrating NSGA-III with the Gale-Shapley algorithm, addressing limitations in prior works. While Sawadsitang et al. focused on structured interview-based allocation without multi-objective optimization, achieving a runtime of 12.5 seconds for 100 interns and 20 organizations [20], our approach combines preference diversity and stability for more balanced results. Using a dataset of 1000 interns and 1000 employers, it achieves comparable or better matching quality with an average runtime of only 5.008 seconds, demonstrating superior scalability and efficiency.

    While our proposed model enhances recruitment efficiency by combining NSGA-III and Gale-Shapley algorithms, several limitations remain. The model assumes rational preferences from both employers and interns, which may not reflect real-world uncertainties. Additionally, our current dataset and simulations are limited in size and diversity, so the computational complexity of multi-objective optimization could become a bottleneck in large-scale applications. Future research could explore incorporating dynamic preferences, applying machine learning to predict or infer rankings, and testing the model with real-world data to further validate and refine its effectiveness.

    1. Conclusion

    Internship recruitment faces challenges in effectively matching employers with interns, leading to missed opportunities for highly skilled interns and underutilized talent, which in turn hampers organizational efficiency and growth. In this paper, we applied the NSGA-III algorithm to generate two unordered sets of individuals with equal matching opportunities, used the Gale-Shapley algorithm to pair them into stable matches, and compared the values of each match to determine the final result. Our study proposed a mathematical model that effectively addresses complex many-to-many pairing problems, demonstrated improved matching quality compared to traditional methods and ultimately achieved a stable matching solution. The NSGA-III algorithm achieves high fitness values, especially with more crossover generations. Combined with the Gale-Shapley algorithm, it ensures optimal pairing efficiency but requires longer execution times for large populations and complex problems. In general, this is crucial for bringing interns and employers together within a labor market that is undergoing major upheavals, making it challenging for interns to get internships.

    REFERENCES

    1. P. Kurniawan and N. Susanto, “The Effect of Job Stress, Job Satisfaction and Emotional Intelligence on Turnover Intention,” Int. J. Sci. Technol. Manag., vol. 4, no. 2, pp. 358–365, 2023, DOI: 10.46729/ijstm.v4i2.763.
    2. P. Mahesh, “Understanding the development of soft skills in professional students of engineering colleges of rural area of Guntur district,” Alford Council Int. English Lit. J., vol. 7, no. 2, pp. 10–29, Jun. 2024, DOI: 10.37854/ACIELJ.2024.7202.
    3. T. Q. Tran, N. B. T. Vu, and H. V. Vu, “Does job mismatch affect wage earnings among business and management graduates in Vietnam?,” Research in International Business and Finance, vol. 65, p. 101982, 2023, DOI: 10.1016/j.ribaf.2023.101982.
    4. A. Uz-Zaman and M. A. M. Khan, “Minimum wage impact on RMG sector of Bangladesh: Prospects, opportunities and challenges of new payout structure,” International Journal of Business and Economics Research, vol. 10, no. 1, pp. 8–20, 2021, DOI: 10.11648/j.ijber.20211001.12.
    5. Y. Rivaldo and S. D. Nabella, “Employee performance: Education, training, experience and work discipline,” 2023, DOI: 10.47750/QAS/24.193.20.
    6. S. Hugar and S. Bhat, “Challenges faced by human resource recruiters in post selection of freshers in IT companies,” 2021, DOI: 10.17605/OSF.IO/C5VTU.
    7. N. Ibrahim, H. M. Hanum, Z. Abu Bakar, and N. A. S. Abdullah, “Student-industry matching for internship placement,” in Proc. 2021 Fifth Int. Conf. Inf. Retr. Knowl. Manag. (CAMP), 2021, pp. 122–126, DOI: 10.1109/CAMP51653.2021.9498088.
    8. M. K. Bairwa and R. Kumari, “Perception and expectations of interns: A study on internship in hospitality education,” in Hospitality and Tourism Emerging Practices in Human Resource Management, 2021.
    9. C. Neves, M. Nogueira, and S. Gomes, “Looking to the future: Grasping students’ expectations regarding employers’ attractiveness,” in EDULEARN Proceedings, vol. 1, pp. 7833–7839, 2021, DOI: 10.21125/edulearn.2021.1597.
    10. Y. Hou, “Avoiding the gap of college students’ internship expectations and perceptions—A case study in Taiwan,” Open J. Nurs., vol. 8, no. 8, pp. 531–551, 2018, DOI: 10.4236/ojn.2018.88040.
    11. A. E. Roth and L. S. Shapley, “The theory of stable allocations and the practice of market design,” American Economic Review, vol. 102, no. 4, pp. 1660-1682, 2012, DOI: 10.1257/AER.102.4.1660.
    12. D. M. Edmonds, O. Zayts-Spence, Z. Fortune, and J. S. Y. Fung, “Graduates’ perceptions and employers’ expectations: Essential skills in Hong Kong workplaces during the COVID-19 pandemic and beyond,” Industry and Higher Education, vol. 38, no. 1, pp. 23–34, 2024, DOI: 10.1177/09504222231224087.
    13. N. T. N. Ha and E. Dakich, “Student internship experiences: areas for improvement and student choices of internship practices,” Education + Training, vol. 64, no. 4, pp. 516–532, 2022, DOI: 10.1108/ET-09-2021-0337.
    14. I. Ashlagi, J. Chen, M. Roghani, and A. Saberi, “Stable Matching with Interviews,” Proceedings of the 16th Innovations in Theoretical Computer Science Conference (ITCS 2025), vol. 325, pp. 12:1–12:20, 2025, DOI: 10.4230/LIPIcs.ITCS.2025.12.
    15. H. Lee, H. Lee, S. Jung, and J. Kim, “Stable marriage matching for traffic-aware space-air-ground integrated networks: A Gale-Shapley algorithmic approach,” in Proc. 2022 Int. Conf. Inf. Netw. (ICOIN), pp. 474–477, 2022, DOI: 10.1109/ICOIN53446.2022.9687261.
    16. Opris, A., Dang, D. C., Neumann, F., and Sudholt, D., 2024. “Runtime Analyses of NSGA-III on Many-Objective Problems”. In Proceedings of the Genetic and Evolutionary Computation Conference Companion (GECCO ’24 Companion), July 2024. DOI: 10.1145/3638529.3654218.
    17. S. Wietheger and B. Doerr, “A mathematical runtime analysis of the non-dominated sorting genetic algorithm III (NSGA-III),” in Proc. 32nd Int. Joint Conf. Artif. Intell. (IJCAI), Macao, Macau SAR China, Aug. 2023.
    18. H. Yang, R. Chen, and S. Kumara, “Stable matching of customers and manufacturers for sharing economy of additive manufacturing,” J. Manuf. Syst., vol. 61, pp. 1–12, Oct. 2021, DOI: 10.1016/j.jmsy.2021.09.013.
    19. D. Yang, X. Zhou, Z. Yang, Q. Jiang, and W. Feng, “Multi-objective optimization model for flexible job shop scheduling problem considering transportation constraints: A comparative study,” in 2020 IEEE Congress on Evolutionary Computation (CEC), 2020, pp. 1–8, DOI: 10.1109/CEC48606.2020.9185653.
    20. S. Sawadsitang, D. Niyato, W. Mahanan, J. Thanyaphongphat, and R. Kaewpuang, “Intern-organization interview matching framework: An optimization approach,” in 2022 37th International Technical Conference on Circuits/Systems, Computers and Communications (ITC-CSCC), 2022, pp. 947–950, DOI: 10.1109/ITC-CSCC55581.2022.9895049.
    21. A. Zakrzewska, “A modification of the Gale-Shapley algorithm used to assign Polish pupils to schools,” Studia Informatica Syst. Inf. Technol., vol. 30, no. 1, pp. 97–104, 2024, DOI: 10.34739/si.2024.30.07.
    22. V. Soni, “AI in job matching and recruitment: Analyzing the efficiency and equity of automated hiring processes,” in 2024 International Conference on Knowledge Engineering and Communication Systems (ICKECS), 2024, pp. 1–5, DOI: 10.1109/ICKECS61492.2024.10617325.
    23. Z. Elgammal, A. Barmu, H. Hassan, K. Elgammal, T. Özyer, and R. Alhajj, “Matching applicants with positions for better allocation of employees in the job market,” in 2021 22nd International Arab Conference on Information Technology (ACIT), 2021, pp. 1–5, DOI: 10.1109/ACIT53391.2021.9677374.
    24. M. Hu, W. Zhu, and X. Yu, “Application of Gale–Shapley algorithm in optimal matching for healthcare facilities to elderly population: The case of Hangzhou, China,” Applied Economics, vol. 56, no. 10, pp. 913–925, 2024. DOI: 10.1080/00036846.2024.2320175.
    25. A. A. D. Mendoza, L. J. C. Barbosa, D. M. A. Cortez, R. M. Dioses, V. A. Agustin, and R. C. Regala, “Enhancement of Gale-Shapley algorithm with imbalanced sets for hiring and job finding applications,” Indones. J. Electr. Eng. Comput. Sci., vol. 27, no. 2, pp. 954–958, 2022, DOI: 10.11591/ijeecs.v27.i2.pp954-958.
    26. Yue Wu, A. J. H. Brown, and J. E. Moore Jr., “Inefficiencies in residency matching associated with Gale–Shapley algorithms,” Ophthalmology, vol. 130, no. 2, pp. 183–191, Feb. 2023, DOI: 10.1016/j.ophtha.2022.09.017.
    27. A. V. Ugale, “Resume clustering and job description matching,” Int. J. Res. Appl. Sci. Eng. Technol., vol. 13, no. 4, pp. 2881–2887, 2025, DOI: 10.22214/ijraset.2025.68831.
    28. S. Pudasaini, S. Shakya, S. Lamichhane, S. Adhikari, A. Tamang, and S. Adhikari, “Scoring of resume and job description using Word2vec and matching them using Gale–Shapley algorithm,” in Proceedings of the International Conference on Advanced Computing and Intelligent Engineering (ICACIE 2021), 2022, pp. 1–10, DOI: 10.1007/978-981-16-2126-0_55.
    29. H. Aziz, A. Baychkov, and P. Biró, “Cutoff stability under distributional constraints with an application to summer internship matching,” Math. Program., vol. 203, pp. 247–269, 2024, DOI: 10.1007/s10107-022-01917-1.
    30. A. Masood, G. Chen, and M. Zhang, “Feature selection for evolving many-objective job shop scheduling dispatching rules with genetic programming,” in Proc. IEEE Congr. Evol. Comput. (CEC), Kraków, Poland, 2021, pp. 644–651, DOI: 10.1109/CEC45853.2021.9504895.
    31. Y. He, L. Liu, J. Mao, and Z. Liao, “Improved NSGA-III algorithm for solving multi-objective flexible job shop scheduling problem,” in Proc. 7th CAA Int. Conf. Veh. Control Intell. (CVCI), Changsha, China, 2023, pp. 1–6, DOI: 10.1109/CVCI59596.2023.10397364.
    32. M. Fan, J. Chen, Z. Xie, H. Ouyang, S. Li, and L. Gao, “Improved multi-objective differential evolution algorithm based on a decomposition strategy for multi-objective optimization problems,” Sci. Rep., vol. 12, no. 1, 2022, DOI: 10.1038/s41598-022-25440-7.
    33. C. L. Hicklenton, D. W. Hine, A. B. Driver, and N. M. Loi, “How personal values shape job seeker preference: A policy capturing study,” PLoS ONE, vol. 16, no. 7, 2021, DOI: 10.1371/journal.pone.0254646.
    34. G. Lyu, W. C. Cheung, C.-P. Teo, and H. Wang, “Multi-objective stochastic optimization: A case of real-time matching in ride-sourcing markets,” Manuf. Serv. Oper. Manag., 2023, DOI: 10.1287/msom.2020.0247.
    35. Z. Á. Mann, “The Top Eight Misconceptions about NP-Hardness,” Computer, vol. 50, no. 5, pp. 72–75, May 2017, DOI: 10.1109/MC.2017.146.​
    36. O. Saidani, L. J. Menzli, A. Ksibi, N. Alturki, and A. S. Alluhaidan, “Predicting student employability through the internship context using gradient boosting models,” IEEE Access, vol. 10, pp. 46472–46489, 2022, DOI: 10.1109/ACCESS.2022.3170421.
    37. K. C. Tan, E. F. Khor, T. H. Lee, and Y. J. Yang, “A tabu-based exploratory evolutionary algorithm for multiobjective optimization,” Artif. Intell. Rev., vol. 19, no. 3, pp. 231–260, May 2003, DOI: 10.1023/A:1022863019997.
    38. M. Li, X. Liu, and K. Wang, “IPESA-II: Improved Pareto envelope-based selection algorithm II,” in Proc. 7th Int. Conf. Simulated Evolution Learn. (SEAL), Lecture Notes in Computer Science, vol. 7811, pp. 143–151, 2013, DOI: 10.1007/978-3-642-37140-0_14.
    39. F. Corno, M. S. Reorda, and G. Squillero, “VEGA: A verification tool based on genetic algorithms,” in Proc. Int. Conf. Comput. Design: VLSI Comput. Process. (ICCD), Austin, TX, USA, Oct. 1998, pp. 321–326, DOI: 10.1109/ICCD.1998.727069.
    40. Y. Yuan, H. Xu, and B. Wang, “An improved NSGA-III procedure for evolutionary many-objective optimization,” in Proc. Genet. Evol. Comput. Conf. (GECCO), Vancouver, BC, Canada, Jul. 2014, pp. 661–668, DOI: 10.1145/2576768.2598342.
  • A cooperative game model approach in water resource allocation in countries sharing a river basin based on the SMPSO algorithm

    Nguyễn Trọng Nghĩa-2201040128, Trịnh Huy Thắng-2201040171, Công Trí Thành-2201040166, Phạm Thành Đạt-2201040042, Tô Phương nam-2201040118, Vũ Việt Hoàng-2201040077, Vũ Minh Hạnh-2201040059, Trần Thị Minh Nguyệt-2201040136

    Abstract   

    Countries sharing river basins often find themselves in disputes over water resources, as competition for access to and control over them can lead to conflicts. As industries and farms vied for access, their rivalry led to resource depletion, economic instability, social conflicts, and hindered regional development. Within this context, Game theory (GT) was applied based on various fields such as economic interests, natural resource availability and political status to balance the benefits, promoting win-win scenarios and ensuring long-term collaboration. With the GT and Unified game-based model (UGM), the resolution for water disputes among countries sharing a river basin are facilitated by modeling strategic interactions and offering actionable insights to enhance transboundary water resource management and cooperation. This study integrates the Multi-Objective Evolutionary Algorithm (MOEA) Framework, a platform for solving multi-objective optimization problems, with UGM to address transboundary water allocation. Specifically, the SMPSO algorithm of MOEA frameworks was employed to generate solutions that form a Pareto front, followed by game-theoretic analysis. The aim was to find the Nash equilibrium (NE) that enhances one country’s water resource allocation without affecting the result of any other country.

    Keywords: Water resource allocation, Water conflicts, Game theory, SMPSO

    1. Introduction

    1.1. Background

    The central challenge lies in sharing water in river basins that cross national borders, leading to tensions between countries such as India and Pakistan over the Indus river. Despite treaties being signed like the Indus Waters Treaty between India and Pakistan, these disputes continue to impact regional stability, economic growth, and security [6]. As global water demand is expected to rise by 55% by 2050, competition for water is anticipated to get worse, and climate change is adding to the problem by causing more frequent droughts [5]. If nations do not work together to manage water effectively, water-scarce regions could see their economies shrink by up to 6% [4]. According to Figure 1, the central challenge lies in sharing water in river basins that cross national borders, often leading to tensions such as between India and Pakistan over the Indus River. Although the Indus Basin is not marked as a high-conflict area in the figure, this case shows that even basins with formal treaties can remain politically sensitive. The dark gray areas indicate basins with weak management that pose political, economic, and environmental risks, while gray-black regions highlight ongoing disputes that threaten food and energy security.

    Figure 1: Transboundary Freshwater Dispute Database [30]. 

    To better understand the concerns mentioned above, we analyze the conflicts in population dynamics, socio-economic conditions, and geography in countries sharing a river resources. Countries lacking access to coastlines or navigable rivers often encounter substantial geographical challenges, particularly in ensuring sufficient access to freshwater resources [15]. The water footprint of developed countries increases with above-average consumption patterns and competitive manufacturing, resulting in water management tensions across neighboring areas, where poorer regions are particularly affected by scarcity [11]. Socio-economic status, geographical constrictions, which resulted in environmental instability, are in conflict. Production in both industry and agriculture based largely on water contributed to the loss of soil and the depletion of freshwater [12]. These issues are deeply interconnected, and it is crucial to balance these factors to alleviate conflicts. Figure 2  shows the pressure on water resources across Europe (higher exploitation percentage represents darker color) due to consumption patterns, intended use, and initial impact of seasonal changes.

    Figure 2: Map of Water Exploitation Index (%) for European countries [41].

    To address the aforementioned issues, numerous past studies applying optimization models such as linear optimization, mixed-integer linear optimization and multi-objective programming were conducted [40]. These methods were used under the assumption of perfect cooperation between riparian countries, which was often uncertain in transboundary water sharing. Consequently, water allocation outputs from those models could be unrealistic, as they did not consider the strategic interactions between the sharing countries [39]. GT can assess them by defining decision-making in human rationality as a logical game in which players-nations strategically interact to maximize payoff, on expecting other players’ actions [3]. This is most useful in transboundary water allocation, as it models conflicts and identifies cooperative solutions to avoid exploitation of resources [39]. NE is a core aspect of GT, referring to a stable state where no country can improve its outcome by unilaterally changing its strategy. NE, which earned John Nash the Nobel Prize in 1994, is crucial for water allocation as it ensures cooperation and prevents unfair advantage amid growing water scarcity [7]. With NE as a core principle, GT provides a structured framework for analyzing strategic interactions among countries to ensure that water allocation agreements are equitable and stable. By considering the incentives and potential actions of each party, GT helps design agreements that balance national interests with the long-term sustainability of shared water resources.

    To achieve efficiency in water resource balancing across countries along river basins, we employ multi-objective evolutionary algorithms (MOEAs), which help resolve conflicts between players’ objectives by generating Pareto-optimal solutions. MOEAs have demonstrated efficacy in addressing multi-stakeholder water allocation problems, as evidenced by Kidanu et al. (2023) [1], who applied them to optimize competing multiple objectives within transboundary water systems. In order to capitalize on the advantages of MOEAs, we recommend Speed-constrained Multi-Objective Particle Swarm Optimization (SMPSO), an improved PSO that has been shown to outperform other MOEAs in discovering Pareto-optimized solutions [2], making it well-suited for transboundary water resource optimization. SMPSO limits particle velocity, which assists in the search for optimal allocation strategies, as demonstrated by Zhou et al. (2024) in [9]. While optimization techniques like SMPSO can help identify efficient solutions, addressing strategic conflicts between countries requires GT to model interactions and develop stable strategy allocations by predicting equilibrium outcomes. By integrating SMPSO optimization capabilities with the cooperative framework UGM, we aim to address the water supply–demand imbalance and enable the equitable and efficient water allocation in the river basin area by identifying optimal trade-offs among competing objectives.

    1.2. Related work

    The section gives a comprehensive critique of the pioneering work contained in the literature on the topic of water resource allocation. It introduces the contribution and defines the research gaps offering room for further elaboration and enhancement that are critical to fill in the present study. Several methods and frameworks exist in the literature to reach our current body of understanding about the inherent complex dynamics that underlie the distribution of water. But not all have been carried out with regard to their complete effectiveness.

    Since the past seven years, various optimization techniques and algorithms have been applied to water resource allocation models with specific emphasis on areas of constrained water. Genetic Algorithms and Evolutionary Models are some of the best research lines recently. For instance, Qin et al. [14] integrated bankruptcy theory and an asymmetric power index to optimize fair transboundary water allocation under scarcity conditions. Similarly, Zhao [18] applied a hybrid GA-simulated annealing algorithm to improve agricultural water use efficiency. Subsequently, Janjua et al. [26] also proposed a three-stage cooperative game model incorporating bankruptcy theory, Nash bargaining, and multi-criteria decision-making for allocating water under scarcity.

    Other advanced techniques involved the integration of GT with Particle Swarm Optimization (PSO). Qin et al. [14] addressed transboundary water allocation by incorporating asymmetric power relationships and bankruptcy theory for fair allocation of limited water resources. Mirzaei-Nodoushan et al. [17] contrasted cooperative and non-cooperative game-theoretic policies for transboundary river basins, while Khorshidi et al. [19] employed the integration of agent-based modeling and Game Theory for hierarchical water system management. Tian [16] also showed that game-theoretic methods incorporated with PSO and risk management can conveniently handle uncertainties in water allocation decisions.

    Multi-objective optimization techniques continue to play a significant role in water resource management. Wu [27] applied a programming-based approach to address inefficiencies and unsustainability in water systems. Yan [28] optimized water allocation for the upper Hanjiang River Basin in accordance with the “3 Redlines” policy using the NSGA-II algorithm. Hemati and Abrishamchi [25] applied game theory to develop an equitable water allocation model under climate change conditions. These methods contribute to solving sectoral allocation issues, including hydropower, agriculture, and socio-economic trade-offs, as emphasized in the studies by Peretti and Kilinc [21], [20].

    TechniquesAuthorsStudy/ApplicationKey contributions
    Genetic Algorithms(GA)Janjua et al. in [26]Water allocation with GT, bankruptcy theory & TOPSISThree-stage cooperative model for allocation under scarcity.
    Qin et al. in [14]Transboundary water allocation under scarcityBankruptcy theory and asymmetric power index for equitable, game-based distribution.
    Yin Zhao in [18]Agricultural water efficiency under global scarcityHybrid GA-simulated annealing for improved allocation.
    Particle Swarm Optimization(PSO)Qin et al. in [14]Transboundary water allocation using power asymmetryUses bankruptcy theory and asymmetric index to balance scarcity.
    Mirzaei-Nodoushan et al. in [17]Water allocation in transboundary riversGame theoretic analysis of cooperative vs non-cooperative solutions.
    Khorshidi et al. in [19]Agent-based and GT modeling for water allocationIntegration of Game Theory into complex system allocation models.
    Jiahe Tian in[16]Uncertainty management in water allocationIntegrated PSO with GT and bankruptcy risk models.
    Multi-Objective OptimizationWenyu Wu in [27]Efficiency loss and sustainability in water systemsMulti-Objective Optimization programming to minimize inefficiencies.
    Baowei Yan in [28]Upper Hanjiang River Basin under “3 Redlines” policyNSGA-II for policy-compliant water optimization.
    Hemati & Abrishamchi in [25]Game Theory for water allocation under climate changeGame theoretic model for dynamic basin management.
    Francesca Peretti, Huseyin Cagan Kilinc in [21,20]Hydropower, agriculture, and socio-economic balanceCombined optimization for multi-sectoral water conflicts.

    Table 1: Summary of related work and their key contribution

    Even with many optimisation techniques, like genetic algorithms (GA), particle swarm optimisation (PSO), hybrid models, index quota methods being widely applied in allocating water resources, their applications tend to aim at computational efficiency and prediction accuracy. These applications are, however, conducted without formally being included in the cooperative decision-making model, whose significance is particular in transboundary water management. As a result, even if such approaches optimize technical use of the resources, they do not succeed in treating incompatible interests or formulating balanced and fair deals between stakeholders. To overcome these obstacles, advanced models using cooperative game theory and negotiation-based mechanisms are needed for more balanced, conflict-sensitive shared water resource solutions.

    1.3. Key contributions

    The allocation of the transboundary water resources is embedded in competing country interests, unequal socio-economic situations, and the environment. The lack of cooperation between them creates conflicts and inefficiencies, while rising water demand from population growth and economic news increases competition, making the distribution more challenging. To resolve the above challenges, this paper proposes the main questions that need to be solved:

    1. What key factors should be considered when allocating water resources among countries to ensure equitable and sustainable distribution?
    2. What systematic approach can be applied to balance transboundary water?
    3. How to determine the optimal solution for addressing water allocation problems among nations sharing a river basin?

    For fair and equitable water distribution between nations, hydrological equity, population requirements, and socioeconomic circumstances influence water demand and sustainability [36].  Legal context and climatic volatility make it difficult, as agreements and varying supply influence choice [37]. Infrastructure, technology, and economic evaluation influence efficiency in water utilization. Ultimately, geopolitical forces, driven by power disparities and past conflicts, shape cooperation or conflict between nations [38]. These factors were identified through a comprehensive review of existing literature and case studies on transboundary water conflicts, including studies on international water disputes and data from organizations addressing water management. Balancing all of these factors is essential to achieving equitable transboundary water administration.

    To balance cross-border water distribution, Unified game-based models such as the Multi-Objective Game-Theoretic Model, Nash Bargaining Model, and Multi-Agent System Model integrate hydrological data, economic and social factors, legal regulations, environmental sustainability measures, and multi-objective optimization. These comprehensive models ensure that water allocation remains both equitable and efficient while addressing geopolitical complexities. By balancing national interests with collective resource management, the model fosters sustainable cooperation and long-term stability in transboundary water-sharing agreements.

    SMPSO is a robust approach to optimizing transboundary water allocation by game-theoretic exploration of trade-offs between economic, environmental, and social objectives. It helps find NE by reducing trial and error search to identify stable and Pareto-optimal solutions in which no nation can make a better decision by unilaterally deviating. By integrating SMPSO with cooperative models, decision-makers can systematically acquire NE solutions maximizing overall benefits and promoting long-term cooperation in water supply.

    Using a Unified Game-based model integrating Game theory and SMPSO algorithm, this study offered a novel approach to the complex problem of water distribution among river basin-sharing countries. Our central contributions are:

    • Modelling strategic interactions between countries in transboundary water allocation: Game theory approach was used to analyze the strategic interactions between countries and ensure equitable distribution that satisfies both basin-wide and national goals through Nash equilibrium.
    • The extension of a Unified Game-based model: The model integrated both international conflict resolution and long-term environmental effects analysis to enhance decision-making in water resource allocation.
    • Resolving multi-party conflicts between riparian countries’ objectives: SMPSO, an algorithm within the MOEA framework, was utilized  to optimize the multi-objective aspect of the problem.

    Also, the strategies developed for river basin water distribution can be used to solve other issues in the area of water distribution.

    II. Problem definitions

    The issue was about Transboundary Water Resource Distribution Optimization (TWRDO) within an international river basin where a River Basin Organization (RBO) controlled the allocation of water among the riparian countries. This scenario was captured mathematically by a set P of riparian countries where  P = {P1, …, PM} with each Pi ( 0iM, M N) being a riparian country. The RBO, P0, was a special player that guaranteed fair allocation of water without using any itself so as not to let any country dominate the game. Each riparian country had a set of strategies S , on the other hand, the RBO also had a custom strategy set S0 that specified how TWRDO can be solved with sustainability measures. The goal was to complete the water allocation in a way that was fair, efficient, and sustainable from both ecological and geopolitical perspectives.

    The dataset consists of three nations denoted by M={m1,m2,m3}. Each nation has different characteristics: water productivity, water allocation cost and ecosystem restoration cost. River basin commissions can decide the costs of ecosystem restoration and allocate water strategically to limit negative impacts on ecosystems and ensure long-term ecological sustainability.

    NationsProductivity(USD/m3)Allocation cost(USD/m3)Ecosystem restoration(USD)Water allocated (m3)
    m14.10 1.00350,000200,000
    m25.501.50200,000400,000
    m33.800.90500,000250,000

    Table 2: Example data of water-related characteristics

    The player types examined by Yu & Lu in [31], Yu in [32], and Bi in [13] reveal crucial traits needed for effective optimization in cooperative scenarios. The characteristics of each country within the river basin were defined by multiple factors, including: GDP changes Ei, ecological degradation Ti, area of food production area Si, water distributed Qi and military power Mi. The economic impact Ei was measured through GDP changes resulting from water allocation, while the financial burden of ecological degradation was denoted as Ti​. Food production area, represented by Si was assessed based on the area of land used for essential agricultural production . The amount of water distributed Qi​ and the military power index Mi​  were also considered in decision-making. We also contributed 2 factors:  Ci ( Climate resilience) [4] and Fi ( Feasibility index) [43] in our paper. Including them will enhance the model’s realism, two critical dimensions often overlooked in technical optimization models but essential for the practical implementation of water-sharing strategies. Although both are challenging to quantify precisely, they can be estimated through indirect indicators, such as historical response to drought events for Ci, or expert-based scoring and policy review for Fi​.

    To balance national interests and regional sustainability, riparian countries adopted different strategies. Retaining water often increased economic output Ei and water security Qi but reduced food production area Si and ecological balance Ti, while releasing water enhanced food production area Si and reduced ecological degradation Ti, but often led to lower economic returns Ei. Infrastructure and industrial choices also played a role; dams and high-profit industries boosted Ei​ but raised environmental degradation and military tension (Ti, Mi​), whereas eco-friendly approaches supported long-term sustainability. As a contribution of this study, two new factors were introduced: Ci, measuring a country’s ability to cope with long-term water variability, and Fi, reflecting the institutional and public support for each strategy. Together, these components offer a more comprehensive evaluation of national preferences in cooperative water allocation. In addition to the countries’ strategies, the RBO maintains its own recommendation space S0​, which includes coordinated allocation plans or cooperative rules proposed to guide the system toward equitable outcomes.

    Based on the characteristics and strategies of each player mentioned above, we have established the following tables summarized to make it easier to follow.

    Riparian countriesStrategies
    GDP changes from water allocation (Ei) Financial impact of ecological degradation on a   country (Ti) The military power of country i (Mi) The area of food security production in a country (Si) Amount of water distributed to a country (Qi) Climate resilience (Ci) Feasibility index (Fi​)Retain water (Qi, Si, Ei) Release more water (Si, Ei, Ti) Build dams, reservoirs (Qi, Ei, Ti) Invest in recycling plants (Ti, Mi, Si, Ci) Build polluting manufactures (Ei, Ti, Mi, Fi) Maintain environmental safety (Ti,Mi,Ei, Fi) Expand high-water-usage crops (Ei, Qi, Ti, Ci ) Shift to water-efficient crops (Qi, Ti, Mi, Ei, Ci, Fi)

    Table 3: Summary of players, strategies and their corresponding characteristics 

    Each riparian country in the river basin faces a multi-objective decision problem shaped by national characteristics, including economic benefits Ei, ecological impact Ti, food security Si, water allocation Qi, military sensitivity Mi, climate resilience Ci, and policy feasibility Fi. These characteristics directly influence the country’s strategic objectives. For example, a country prioritizing economic growth may focus on maximizing Ei​ and Qi​, while another with fragile ecosystems may aim to reduce Ti and strengthen Ci​. Countries with strong governance may emphasize feasible policies Fi, even at the cost of short-term returns. As a result, each player evaluates strategies differently based on how well they align with its own characteristic-driven goals, which creates inherent conflicts and trade-offs in regional water allocation.

    Figure 3: Solution Structure for Water Allocation Optimization

    This flowchart outlines the approach to optimizing the distribution of water resources. It begins with identification of key participants, objectives, and benefits, followed by setting up a structured model and necessary parameters. Initial drafts of possible solutions are generated, followed by a determination of effectiveness. The process continues to improve the solutions by several cycles. When an allocation considered fair and efficient is achieved, the solution is tested and released.

    III. Methods

    3.1 Existing model

    Unified 

    The Unified Game-based Model (UGM) effectively resolves multi-party conflicts such as transboundary water disputes. In this framework, the RBO acts as the leader, while riparian countries (followers) adjust strategies. The model promotes equitable outcomes via Nash equilibrium by analyzing strategy sets S and S0​. To formally represent all key components of the allocation framework, we define a cooperative game model G, which includes the set of players, their available strategies, payoff functions, and conflict structure. A typical example is Trinh’s multi-round procurement model [34], which extends the Unified Game-Based Model by specifying players, strategy sets, payoff functions, and conflict relations. In this model, contractors (players) compete over successive rounds under a project owner’s coordination (leader), showcasing UGM’s strength in modeling dynamic, multi-stage negotiations

    3.2 Model for TWRDO

    We utilize the UGM structure by mapping its abstract roles into concrete components in our model. S0 is instantiated as the RBO, responsible for guiding cooperative behavior rather than pursuing its own utility. Riparian countries become strategic agents, each with custom objectives and strategy sets reflecting national characteristics. From this base, we developed a payoff system and conflict measure tailored to water-sharing, enabling the model to resolve trade-offs through equilibrium-based decision-making. This transition from abstract UGM to a structured allocation model forms the core of our contribution.

         G = 〈{P0,P}, {S0,S}, {u0,ui}, Rc〉 (1)

    Where : 

    • P0: The River Basin Organization (special player), which provides strategy recommendations without consuming water.
    • P = {Pi, .. ,PM}  Riparian countries (normal players), where 0 i M, M is the total number of riparian countries, and M ∈ N.
    • S0, S = {Si, .. ,SM} : Strategy sets for the RBO and each riparian country.
    • u0, ui : Payoff functions of the RBO and country Pi, ui is each country’s benefit from allocation, while ​ u0 = ui represents the RBO’s goal of maximizing collective welfare.
    • Rc: The conflict vector space represents the level of conflicts between at least two riparian countries.

    In this model, a Nash equilibrium is defined as a set of strategies where no player can unilaterally improve their payoff, given the strategies of the other players. It represents a stable state where each country’s strategy is optimal, ensuring strategic stability under the RBO’s coordination. To allocate river basin water resources among riparian countries, we introduced a strategy derived from the characteristics and priorities identified in the problem definition, including GDP change, ecological degradation, and water demand. This strategy balances economic efficiency, ecological sustainability, and geopolitical stability, enabling the model to simulate cooperative water allocation decisions.

    Divide based on the watershed area

    Qi=QRiAt (2)

    Where:

    • Qi: Amount of water distributed to country i. (m3)
    • Q: The total amount of water resources in the basin. (m3)
    • At: The total watershed area of the basin. (km2)
    • Ri: The watershed area within each basin country. (km2)

    In our game-theoretic framework, conflict space Rc represents the degree of disagreement between riparian countries’ strategic preferences. Each point in Rc indicates unequal payoffs that may cause negotiation instability or tension. For example, consider two countries p1and p2​ with respective strategy sets that lead to normalized payoffs u1 = 0.9 and u2 = 0.4. The large discrepancy between their payoffs (i.e.,u1 – u2 = 0.5) contributes to the conflict space Rc, indicating a high potential for disagreement. By minimizing this space through cooperative strategy adjustment, the model seeks to approach equilibrium and fairness.

    We define two distinct payoff functions corresponding to the two types of players: the riparian countries and the RBO.

    • Payoff Function for Riparian Countries

    Each riparian country Pi selects a strategy, which is evaluated based on multiple national objectives including Einorm, Tinorm, Qinorm, Sinorm, Minorm, Cinorm, Finorm

    Each follows the general form:

    Xinorm=XiXminXmaxXmin (3)

    Where Xnorm is the normalized value of X , Xi is the original value of the variable X, and Xmin, Xmax are the observed minimum and maximum values respectively across all countries. In cases where Xmax =Xmin , indicating no variation in the variable, the normalized value is defined as Xnorm = 0 to avoid division by zero and reflect the absence of differentiation among countries. The utility function for each country is then defined as:

    ui = Einorm- Tinorm+ Qinorm+ Sinorm- Minorm+ Cinorm+Finorm (4)

    • Payoff Function for the RBO (Special Player)

    The River Basin Organization does not act to maximize its own utility, but rather serves as a strategic coordinator. Its objective is to promote fair and balanced outcomes among all participants. Therefore, its utility is defined as the sum of the utilities of all riparian countries:

    u0 =iMui                                                   (5)                                 

    This formulation ensures that the RBO’s objective is aligned with overall system efficiency and cooperation. By maximizing u0 ​, the model seeks outcomes where all countries benefit to a reasonable extent, while reducing the likelihood of unilateral advantage or conflict. 

    The model enhances realism by incorporating climate resilience and policy acceptability, allowing for more practical and sustainable solutions. Structurally, the payoff functions use normalized components, ensuring consistent scaling and efficient evaluation. This design benefits the SMPSO algorithm by simplifying multi-objective exploration and enabling faster convergence. It also prepares the problem space for the algorithmic approach in the next section, supporting scalable and balanced water allocation decisions.

    3.3. Algorithm

    NP-hard problems are regarded as some of the most computationally intensive challenges, as there are no known polynomial-time algorithms that can ensure an optimal solution for them [42]. Transboundary water allocation was a complex NP-hard problem, characterized by the exponential growth of possible solutions as the number of stakeholders increased. For N stakeholders (N N), the number of possible coalitions was 2N-1, making precise computation infeasible due to the vast solution space. This complexity was further intensified by competing objectives, such as optimizing Ei, minimizing Ti, satisfying Qi​, balancing Si, and considering Mi​. A hybrid approach combining the SMPSO algorithm with a Cooperative game model efficiently explores the solution space, optimizing multi-dimensional objectives while ensuring fairness, stability, and practical outcomes.

    The SMPSO algorithm is a solution space as a swarm of particles, each representing one possible solution for TWRDO. Particles update their positions and speeds iteratively guided by personal best pi and global best gi through payoff functions uiand u0. The time complexity increases exponentially with the number of players, reaching O (2n . jn) due to the combinatorial growth of coalitions and strategy profiles. In this study, SMPSO is configured with 6 particles, 100 iterations, a mutation probability of 0.1, and velocity bounds of [–0.6, 0.6], ensuring computational efficiency for the problem scale. The mechanism of the speed constraint prevents excessive movement and keeps the balance between exploration and exploitation. Normalization of multi-objectives resolves possible conflicts among objectives, and diversity-preserving strategies provide a way to avoid pre-convergence. By processing the particles in parallel, SMPSO can efficiently explore high-dimensional spaces and converge towards Pareto-optimal solutions, hence providing an effective method to solve NP-hard problems within computational feasibility.

    A chromosome in the SMPSO algorithm is a sequence of real-valued genes, where each gene represents a decision variable for one riparian country. For example, the figure below shows a sample chromosome:

    Figure 4: Sample chromosome encoding

    In this chromosome, each box represents a gene, and the values {25, 5, 10, 15, 20, 25} indicate the selected strategy in dealing with others for each of the six riparian countries. These values are decision variables each representing how a country chooses to interact with others, such as through water allocation or managing ecological costs. Together, the genes form a complete strategy profile, allowing evaluation of outcomes when all countries follow the specified strategies.

    To represent potential Nash equilibrium strategies in the SMPSO algorithm, each particle in the swarm is modeled as a chromosome containing real-valued genes. Each gene encodes a decision variable such as water allocation, ecological cost, or strategic influence for a riparian country. In our formulation, the chromosome size is 6, corresponding to the number of riparian countries considered in the model. A complete chromosome captures a multi-country strategy profile, enabling the algorithm to evaluate whether a given combination satisfies the NE condition, where no country benefits from changing its strategy unilaterally.

    Figure 5: The mutation process of choosing chromosome

    Where : 

    • The six genes represent the chromosome for a set of Riparian countries P = {P1, P2, P3, P4, P5, P6}. 
    • Each element is the percentage of water allocated to a specific country from the total available water in the river basin.

    The fitness function evaluates solution quality by balancing fairness and total social benefit. Let ui, uj​ be the payoffs of countries i and j, and N the number of riparian countries. The total payoff u0 = i = 1Nuireflects the overall system efficiency. The numerator 1 i < j N ui – uj measures inequality among countries, while the denominator N u0 normalizes this by total benefit. A smaller fitness value F indicates more equal and efficient water allocation. The function is defined as: 

       F =1000* 1 i < j N ui – uj N u0                                                 (6)

    The SMPSO algorithm then updates the strategies in the chromosomes, helping to find the best way to distribute water among the countries. The flowchart below demonstrates how the SMPSO

    algorithm works to find solutions for water distribution among riverine countries:

    Figure 6: Flowchart of how the SMPSO algorithm works for the problem

    The flow chart describes the following steps to solve the problem. The algorithm first initializes a swarm particle with random positions p0 and an empty leader archive to store the best discovered particle, also known as the best solution. In the first generation (i=0), the  particles velocity are set to 0 (v0=0), as i increase, v are updated to discover new position (p). Max generation (Imax) is a pre-defined iteration, in each generation every particle is calculated and assessed based on their fitness function result  to discover the potential Gbest. Then the Gbest iteratively compare candidates by better positioned particles. The generation count stops and returns the leader archive result when it reaches Imax.

    Figure 6: Pseudocode of SMPSO algorithm in water allocation problem

    The pseudocode above outlines a modified SMPSO algorithm for transboundary water allocation. Inputs include M, N, Genmax, strategy sets, constraints (e.g., water balance), and Rc. The algorithm generates Gbest that balances fairness and conflict reduction. It initializes particles, evaluates fitness based on payoff vectors, updates positions and velocities, applies constraints, and introduces mutation. After all generations, the best solution is selected based on utility and minimal conflict.

    IV. Result

    This section introduces the experimental framework for river basin nations to maximize transboundary water allocation. Our approach combines the SMPSO algorithm with Game Theory to identify balanced, efficient water allocation strategies that solve the conflicting needs and potential disagreements between nations. The configuration we used in this section includes an AMD Ryzen 5 7530U with Radeon Graphics CPU, 6 CPU Physical cores, 12 CPU Logical cores, 15.4 GiB of Total Physical Memory, and Windows 11 operating system. The table below includes the necessary information about the algorithm parameters.

    Experiment parametersMaximum generations(gmax)Mutation probability(Pm)Speed constraints(vmin, vmax)Payoff weight(wi)
    value1000.1[-0.6, 0.6]1

    Table 4: Experiment parameters for SMPSO

    Table 4 summarizes the key variables used in the SMPSO algorithm, including the number of participating countries, the number of optimization iterations, mutation rate, velocity bounds for particle movement, and the payoff weighting. These variables collectively guide the algorithm’s search process and convergence towards equitable and efficient water allocation outcomes.

    In this context, a dataset comprising weighted values of various factors influencing the allocation of water resources among countries sharing the Lancang-Mekong [13]. Our sample  dataset, which was referenced from [13] and  the SIPRI Military Expenditure Database, includes information on 6  riparian countries, each considering two distinct strategies. Each country is characterized by 7 metrics, including GDP changes, ecological impact, food security area, watershed area, and water rights. Table 5 below is a partial representation of the dataset for the first four countries:

    CountryStrategyEinormQinormSinormTinormMinormCinormFinorm
    ChinaStrategy 1000.6730.5080.9300.2650.6370.9290.956
    CambodiaStrategy 580.2910.6420.6010.5110.3910.270.34
    LaosStrategy 590.8170.8990.2300.6130.7540.1000.273
    VietnamStrategy 1000.5950.9920.0770.6310.3010.4290.216
    ThailandStrategy 1000.5430.8630.2790.5840.9720.3730.814
    MyanmarStrategy 340.1750.2990.8960.4810.6310.2100.765

    Table 5: A part of the dataset for riparian countries.

    With the data set partially provided in Table 5, the results statistics are shown in Table 6, and Figure 8. The optimal solution for each country with the payoff value respectively by using SMPSO algorithm is shown in Table 6, demonstrating the relationship between profit and loss among countries.

    PlayerStrategy numberEinormTinormQinormSinormMinormCinormFinormPayoff value
    China1000.2930.4060.7400.3190.1450.0040.1021.05
    Cambodia580.2400.5250.3940.0100.5590.4070.3661.02
    Laos590.2720.6650.0020.0580.6040.2400.7760.98
    Myanmar1000.4120.8110.1780.3900.5230.0990.6331.00
    Vietnam1000.0101.0701.0040.6630.6780.7500.0920.97
    Thailand340.0410.8250.3860.1940.5640.6710.0761.01

    Table 6: Result of the experiment

    The table below supports the comparison between algorithms by highlighting SMPSO’s performance through its fitness values across iterations over time (in seconds). Moreover, the evolution of fitness values over time illustrates the distinct progression patterns of each algorithm.

    IterationFitness value/Time(sec)
    VEGANSGAIINGSAIIISMPSOOMOPSO
    17.2/5.086.25/5.19.5/5.172.96/5.067.37/5.06
    26.34/5.115.29/5.118.09/5.286.67/5.044.36/5.04
    36.98/5.116.39/5.0810.3/5.225.85/5.031.47/5.0
    48.4/5.086.74/5.179.05/5.257.19/5.042.61/5.06
    56.4/5.075.16/5.0812.03/5.245.26/5.059.48/5.05
    67.98/5.077.3/5.0810.12/5.227.01/5.0213.77/5.0
    77.16/5.12.69/5.048.64/5.167.54/5.034.95/5
    88.34/5.093.75/5.1310.95/5.228.04/5.055.62/5.03
    97.1/5.116.32/5.0211.5/5.088.64/5.024.81/5.01
    107.07/5.097.05/5.0210.51/5.215.51/5.034.23/5.04

    Table 7: Comparison in performance of different algorithms

    balanced water allocation solutions 

    The figure 8 below clearly illustrates the relationship between fitness value and runtime of the SMPSO algorithm across iterations. The red bars show significant variation in fitness values, while the blue line indicates that runtime remains relatively stable. This visualization effectively highlights how solution quality fluctuates more than computational cost. The use of dual axes allows easy comparison, emphasizing that higher fitness does not always require longer runtime. Overall, the chart provides a concise and intuitive view of SMPSO’s performance in both efficiency and effectiveness.

    Figure 8: The correlation between fitness value and runtime for SMPSO algorithms

    Figure 9 below shows the runtime comparison of different optimization algorithms (VEGA, NSGAII, NSGAIII, SMPSO, and OMOPSO) using a line chart. The chart displays the computational time of each algorithm with corresponding iterations. 

    1. Iteration1                                                                             b)   Iteration 2

          c)   Iteration 3                                                                               d)   Iteration 4

    Figure 7: Comparison of runtime (in second) of different algorithms

    Figures 8 and 9 compare the fitness values and runtimes of VEGA, NSGA II, NSGA III, SMPSO, and OMOPSO across ten trials in solving multi-objective optimization problems.  SMPSO demonstrated strong overall performance with fitness values ranging from 2.96 to 8.64, and runtimes consistently maintained between 5.02 and 5.08 seconds. Although a slight dip occurred in trial 1, SMPSO’s fitness remained stable in most trials. VEGA showed moderately high fitness values with peaks above 8.4 in trials 4 and 8, but its performance was less stable. NSGA III reported the highest fitness values overall, surpassing 12.03 in trial 5, and its runtime also remained highest in five algorithms, about 5.2 seconds in most of the trials. NSGA II displayed more fluctuation in fitness, dropping to 2.69 in trial 7, while keeping a relatively narrow runtime range between 5.02 and 5.17 seconds. Among the algorithms, SMPSO stood out for delivering consistently low runtimes and competitive fitness levels, making it a reliable and efficient option for multi-objective optimization tasks.

    V. Discussion

    Among the evaluated optimization algorithms, VEGA, NSGA-II, NSGA-III, OMOPSO, and SMPSO, SMPSO consistently achieved superior performance, with the shortest average runtime of 5.02 seconds and lowest average fitness value of 6.47. These findings align with Chen [2], emphasizing SMPSO’s ability to solve complex multi-objective problems like transboundary water management with stable convergence and low runtime.

    The experiment revealed that SMPSO consistently outperformed the other algorithms across multiple trials, achieving a minimum fitness value of 2.96 and showing the narrowest variance in results. In contrast, NSGA-III produced fitness values up to 12.03, with greater instability between runs. Interestingly, while NSGA-III and VEGA are often favored in multi-objective optimization, they underperformed in both precision and consistency when applied to this real-world water allocation context. These outcomes confirm Chen et al. [2]’s conclusions about SMPSO’s effectiveness under complex trade-offs. Moreover, by embedding a game-theoretic framework, the model replicated strategic negotiation patterns among countries, similar to the cooperative mechanisms explored by Bi et al. [13] and Tian et al. [16], reinforcing the model’s real-world applicability.

    Despite its promising results, the study has limitations. The use of a simplified dataset may not capture the full socio-political and hydrological complexities of real-world river basins. Future research should integrate real-time hydrological data, support dynamic and stochastic conditions, and consider non-cooperative behaviors. Enhancing the model’s responsiveness to political, legal, and environmental uncertainties would improve its practical relevance.

    VI. Conclusion

    This paper considers the difficulties of allocating water resources among countries sharing a river basin, which is increasingly complex due to competing demand and water scarcity.  Our method for efficient water distribution utilizes SMPSO within a cooperative game model, allowing the balance of multiple factors in riparian nations. This method enables optimal negotiation outcomes among countries, owing to the success depends on accurately defining the objectives and constraints involved. Applying this method, the paper introduces an approach that can effectively balance the competing economic and ecological benefits associated with water resource allocation. At the same time, it emphasizes minimizing potential conflicts and promoting cooperation among the countries that share a river basin. Experimental results demonstrated that SMPSO outperformed other algorithms in the multi-objective optimization problems, with stable fitness values and efficient runtimes. Among the different algorithms discussed in the study, SMPSO stood out as a reliable and sustainable solution that can be effectively applied to the resource distribution field. This research contributes to water management by providing a different approach for equitable distribution based on negotiations through many conflict multi-objective elements. It enhances decision-making in sectors where water allocation is critical to both regional cooperation and long-term sustainability. 

    References

    [1]    R. A. Kidanu, M. Cunha, E. Salomons, and A. Ostfeld, “Improving Multi-Objective Optimization Methods of Water Distribution Networks,” Water, vol. 15, no. 14, p. 2561, Jul. 2023, doi: 10.3390/w15142561.

    [2]    Chen, F., Liu, Y., Yang, J., Liu, J., & Zhang, X. (2024, May). A multi-objective particle swarm optimization with a competitive hybrid learning strategy. In Complex & Intelligent Systems. Springer. doi: 10.1007/s40747-024-01447-7

    [3]   Ting, C. H. E. N., En, X. U., Haowen, W. A. N. G., JIANG, N., & Qian, W. U. (2023,

            September). Application of Game Theory in Distribution Networks. In 2023 International

            Conference on Management Innovation and Economy Development (MIED 2023) (pp.

            394-405). Atlantis Press. doi: 10.2991/978-94-6463-260-6_51

    [4]    World Bank. (2016). High and Dry: Climate Change, Water, and the Economy. Washington, DC: The World Bank. https://openknowledge.worldbank.org/server/api/core/bitstreams/5bf39931-836c-54da-953f-15d8330d87d3/content

    [5]     Consequences, T. (2012). OECD environmental outlook to 2050: the consequences of inaction. Int J Sustain High Educ, 13. doi: 10.1787/9789264122246-en

    [6]     World Bank. (2018). (n.d.). Fact Sheet: The Indus Waters Treaty (1960) and the World Bank. Retrieved October 25, 2024. https://www.worldbank.org/en/region/sar/brief/fact-sheet-the-indus-waters-treaty-1960-and-the-world-bank

    [7]     Mirzaei-Nodoushan, F., Bozorg-Haddad, O., & Loáiciga, H. A. (2022, March). Evaluation of cooperative and non-cooperative game theoretic approaches for water allocation of transboundary rivers. In Scientific Reports, 12, 4385. Nature Publishing Group. doi: 10.1038/s41598-022-07971-1

    [8]     Keshavarzzadeh, A. H. (2022). Optimized water allocation in persistent severe climatic conditions: A novel metaheuristic approach. Water Research, 224, 119072. doi:10.1016/j.watres.2022.119072

    [9]     Zhou, M., Sun, D., Wang, X., Ma, Y., Cui, Y., & Wu, L. (2024, April). Multi-objective optimal allocation of water resources in Shule River Basin of Northwest China based on climate change scenarios. In Journal of Hydrology, 633, 129330. Elsevier. doi: 10.1016/j.agwat.2024.109015

    [10]   Schmeier, S. (2021). International water law principles in negotiations and water diplomacy. doi: 10.1017/aju.2021.21

    [11]   Chen, W., Kang, J. N., & Han, M. S. (2021, June). Global environmental inequality: Evidence from embodied land and virtual water trade. In Science of the Total Environment, 781, 146722. Elsevier. doi: 10.1016/j.scitotenv.2021.146992 

    [12]   Panagoulia, D., & Zisopoulou, K. (2021, June). An in-depth analysis of physical blue and green water scarcity in agriculture in terms of causes and events and perceived amenability to economic and policy interventions. In Water, 13(12), 1693. MDPI. doi: 10.3390/w13121693

    [13]   Bi, F., Zhou, H., Zhu, M., & Wang, W. (2022). Economic benefit evaluation of water resources allocation in transboundary basins based on particle swarm optimization algorithm and cooperative game model—A case study of Lancang-Mekong River Basin. PloS one, 17(7), e0265350. doi: 10.1371/journal.pone.0265350

    [14]   J. Qin, X. Fu, X. Wu, J. Wang, J. Huang, X. Chen, J. Liu, and J. Zhang, “Transboundary Water Allocation under Water Scarcity Based on an Asymmetric Power Index Approach with Bankruptcy Theory,” Water, vol. 16, no. 19, p. 2828, Sep. 2024, doi: 10.3390/w16192828.

    [15]   Indriyani, Rachma. (2017). The Interplay Between Laos as Landlocked State and its Surrounding Coastal States. Yustisia Jurnal Hukum. 6. 10.20961/yustisia.v6i2.12534. Doi: 10.20961/yustisia.v6i2.12534.

    [16]   Tian, J., Yu, Y., Li, T., Zhou, Y., Li, J., Wang, X., & Han, Y. (2022). A cooperative game model with bankruptcy theory for water allocation: a case study in China Tarim River Basin. Environmental Science and Pollution Research, 29(2), 2353-2364. doi: 10.21203/rs.3.rs-439945/v1

    [17]   F. Mirzaei-Nodoushan, O. Bozorg-Haddad, and H. A. Loáiciga, “Evaluation of Cooperative and Non-Cooperative Game Theoretic Approaches for Water Allocation of Transboundary Rivers,” Scientific Reports, vol. 12, no. 1, p. 3991, 2022. [Online]. Available: doi: 10.1038/s41598-022-07971-1

    [18]   Zhao, Y., Li, G., Li, S., Luo, Y., & Bai, Y. (2024). A Review on the Optimization of Irrigation Schedules for Farmlands Based on a Simulation–Optimization Model. Water, 16(17), 2545. doi: 10.3390/w16172545

    [19]   M. S. Khorshidi, M. R. Nikoo, G. Al-Rawas, N. Bahrami, M. Al-Wardy, N. Talebbeydokhti, and A. H. Gandomi, “Integrating Agent-Based Modeling and Game Theory for Optimal Water Resource Allocation within Complex Hierarchical Systems,” Journal of Cleaner Production, vol. 482, p. 144164, 2024. [Online]. Available: doi: 10.1016/j.jclepro.2024.144164

    [20]   Kilinc, H. C. (2022). Daily Streamflow Forecasting Based on the Hybrid Particle Swarm Optimization and Long Short-Term Memory Model in the Orontes Basin. Water, 14(3), 490. doi: 10.3390/w14030490

    [21]   Peretti, F.; Menapace, A.; Righetti, M. (2024). Optimising Water Allocation for Combined Irrigation and Hydropower Systems. Engineering Proceedings, 69, 66. doi: 10.3390/engproc2024069066

    [22]   Woldeyohanes, T., Kuhn, A., Heckelei, T., & Duguma, L. (2021). Modeling Non-Cooperative Water Use in River Basins. Sustainability, 13(15), 8269. doi: 10.3390/su13158269

    [23]   Adama, G. J., Jimoh, D. O., & Otache, M. Y. (2020). Optimization of irrigation water allocation framework based on genetic algorithm approach. doi:10.4236/jwarp.2020.124019

    [24]   Gebre, S. L., Cattrysse, D., & Van Orshoven, J. (2021). Multi-criteria decision-making methods to address water allocation problems: A systematic review. Water, 13(2), 125. doi: 10.3390/w13020125

    [25]   H. Hemati and A. Abrishamchi, “Water Allocation Using Game Theory under Climate Change Impact (Case Study: Zarinehrood),” Journal of Water and Climate Change, vol. 12, no. 3, pp. 759–771, 2021. [Online]. Available: https://doi.org/10.2166/wcc.2020.153.

    [26]   S. Janjua, D.-A. An-Vo, K. Reardon-Smith, and S. Mushtaq, “A Three-Stage Cooperative Game Model for Water Resource Allocation Under Scarcity Using Bankruptcy Rules, Nash Bargaining Solution and TOPSIS,” Water Resources Management, 2025. [Online]. Available: doi: 10.1007/s11269-025-04123-8

    [27]   Wu, W., Zhao, X., Zhang, X., Wu, X., Zhao, Y., & Guo, Q. (2024, March). An ordered multi-objective fuzzy stochastic approach to sustainable water resources management: A case study from Taiyuan City, China. In Water Supply, 24(3), 865–880. IWA Publishing. doi: 10.2166/ws.2024.035

    [28]   Yan, B., Jiang, H., Zou, Y., Liu, Y., Mu, R., & Wang, H. (2022). An integrated model for optimal water resources allocation under “3 Redlines” water policy of the upper Hanjiang river basin. Journal of Hydrology: Regional Studies, 42, 101167. doi:10.1016/j.ejrh.2022.101167

    [29]   Zhang, D., Xie, X., Wang, T., Wang, B., & Pei, S. (2022). Research on water resources allocation systems based on rational utilization of brackish water. Water, 14(6), 948.        doi: 10.3390/w14060948

    [30]   Ganoulis, J., Fried, J.(2018). Transboundary water conflicts and cooperation. Transboundary Hydro-Governance: From Conflict to Shared Management, 55-76.          doi: 10.1007/978-3-319-78625-4_3

    [31]   Yu, S., & Lu, H. (2018). An integrated model of water resources optimization allocation based on projection pursuit model–Grey wolf optimization method in a transboundary river basin. Journal of Hydrology, 559, 156-165. doi: 10.1016/j.jhydrol.2018.02.033

    [32]   Yu, Y., Tang, P., Zhao, J., Liu, B., & Mclaughlin, D. (2019). Evolutionary cooperation in transboundary river basins. Water Resources Research, 55(11), 9977-9994.                     doi: 10.1029/2019WR025608

    [33]   Jeong, G., & Kang, D. (2021). Hydro-Economic Water Allocation Model for Water Supply Risk Analysis: A Case Study of Namhan River Basin, South Korea. Sustainability, 13(11), 6005. doi: 10.3390/su13116005

    [34]   Trinh, B. N., Thang, H. Q., Nguyen, X. T., Luong, P. C., & Ho, N. K. (2019, September). Applying a Unified Game-Based Model in a Payment Scheduling Problem and Design of Experiments Using MOEA Framework. In SoMeT (pp. 55-68). doi:10.3233/FAIA190038 

    [35]   Gerlak, A. K., & Haefner, A. (2017). Riparianization of the Mekong River Commission. Water International, 42(7), 893–902. doi: 10.1080/02508060.2017.1376267

    [36]   Lu, Y., Ma, Z., Wang, T., Xie, X., & Gu, Y. (2022). Development of a water resource allocation model based on the dynamic exploitable amount of groundwater and its application in Jinghe County, Xinjiang. Frontiers in Environmental Science, 10, 946072. doi: 10.3389/fenvs.2022.946072

    [37] Asl-Rousta, B., & Mousavi, S. J. (2025, February). Bankruptcy rules and sustainable water management: A MODSIM–NSGA-II simulation multi-objective optimization framework for equitable transboundary water allocation. In Environmental and Sustainability Indicators, 18, 100269. Elsevier. Retrieved from https://doi.org/10.1016/j.indic.2025.100648

    [38]  X. Wu, W. He, L. Yuan, R. Li, Y. Qi, D. Yang, D. M. Degefu, and T. S. Ramsey, “Two-stage water resources allocation negotiation model for transboundary rivers under scarcity,” Frontiers in Environmental Science, vol. 10, p. 900854, Aug. 2022, doi: 10.3389/fenvs.2022.900854.

    [39]  D. Juízo and R. Líden, “Modeling for transboundary water resources planning and allocation,” Hydrology and Earth System Sciences Discussions, vol. 5, no. 2, pp. 475–509, 2008. doi: 10.5194/hess-14-2343-2010

    [40]  Babel, Mukand & Das Gupta, Ashim & Nayak, D.. (2005). A Model for Optimal Allocation of Water to Competing Demands. Water Resources Management. 19. 693-712. doi: 10.1007/s11269-005-3282-4 

    [41]  Karner, Katrin & Schmid, Erwin & Schneider, Uwe & Mitter, Hermine. (2021). Computing stochastic Pareto frontiers between economic and environmental goals for a semi-arid agricultural production region in Austria. Ecological Economics. 185. 107044. doi: 10.1016/j.ecolecon.2021.107044 

    [42]  Rey, D., Pérez-Blanco, C. D., Escriva-Bou, A., Girard, C., & Veldkamp, T. I. E. (2018). Role of economic instruments in water allocation reform: lessons from Europe. International Journal of Water Resources Development, 35(2), 206–239. doi: 10.1080/07900627.2017.1422702

    [43]   F. Li, “Fair and Reasonable Allocation of Trans-Boundary Water Resources Based on an Asymmetric Nash Negotiation Model from the Satisfaction Perspective: A Case Study for the Lancang–Mekong River Basin,” Water, vol. 12, no. 11, p. 3001, 2020.

  • A game-theoretical approach to solve the oilprice problem using the NSGA-II model

    A game-theoretical approach to solve the oilprice problem using the NSGA-II model

    July 21, 2022

    by

    • Hoang Bao Vy – 1901040248
    • Luu Thi Thu Huyen – 1901040098
    • Tong Thi Tram – 1901040228
    • Tran Hoang Lan – 1901040120
    • Pham Thi Mai Anh – 1901040021

    Supervised by: Dr. Trinh Bao Ngoc

    Abstract

    The oil is a critical and essential product of the global system that directly affects global activities. However, the erratic change in oil price has become an extremely noticeable concern that needs to be solved to limit the impact on the costs of other industries as well as people’s lives in society. To make an attempt in solving this problem, we are trying to apply a negotiation model in which each oil firm does its best to achieve the broadest possible share so that game theory and Nash equilibrium can easily shed light on this problem (Bratvold & Koch, 2011). In this paper, we will examine the oil price problem by using game theory and applying the NSGA-II model to tackle the problem. The NSGA-II model enables us to solve conflicts between multiple objectives and also analyze price changes, and in this particular case, NSGA-II will be used to deal with all the non-linearities while considering real-world circumstances. The experiment that we demonstrated will show how effective it is to apply this model to deal with the price conflict in the oil industry, thereby yielding the most optimal balance between the stakeholders, which could be a promising solution.

  • Apply game theory in modeling solutions to solvewater conflict among countries in the Mekong RiverBasin by Non-dominated Sorting Genetic Algorithm-II (NSGA-II)

    Apply game theory in modeling solutions to solvewater conflict among countries in the Mekong RiverBasin by Non-dominated Sorting Genetic Algorithm-II (NSGA-II)

    Hanoi – 2022

    Supervised by: Dr. Trinh Bao Ngoc

    by

    • Nguyen Tung Anh – 1901040014
    • Pham Chung Duc – 1901040014
    • Nguyen Minh Duc – 1901040014
    • Pham Thi Loan – 1901040014
    • Nguyen Duc Long – 1901040014

    Abstract

    There have been water tensions between countries in the Mekong basin area for a long time due to the fact that hydropower building and exploitation of water resources in many fields in upstream countries have had an impact on the condition and condition of water downstream. Clashes over water assets occur in a variety of industries, including agriculture, hydropower, fisheries, pollution, ecosystem diversity, navigation, ecotourism, and alluvium. Since its inception, game theory has been utilized to imagine social circumstances among competing players and aid participants in choosing optimal decisions in strategic situations. Therefore, using the game theory model, with each country in the Mekong River basin acting as a player with its strategy, the basin’s countries then come to a settlement on the advantages of using water resources, which improve bilateral ties, decrease conflicts of interest, and ensure the long-term sustainability of water resources. Furthermore, by using the NSGA-II algorithm, leaders of countries identify suitable solutions to the water dispute in the Mekong River area. Lastly, our aim in the study is not only to figure out the specifically algorithmic method for six Mekong neighboring countries to effectively exploit the abundantly riparian water resources but also to contribute a new math formula in managing water conflicts among many other rivers on the planet.

  • The application of Game Theory and NSGA-IIalgorithm to allocate resources in Emergency Management

    The application of Game Theory and NSGA-IIalgorithm to allocate resources in Emergency Management

    July 22, 2022

    by Pham Quang Ha, Nguyen Trung Kien, Tran Duong Son, Nguyen To Uyen, Vu Hong Van

    Abstract

    When emergencies such as natural disasters or pandemics happen, it is clear that effective decision-making is critical for equitable and optimal allocation of resources. If there are more demands than resources available, it will cause many conflicts between emergency centers such as how to respond equally to locations or conflicts between allocation decision-makers. To solve that problem, we provided an alternate instruction to existing balanced resource allocation processes using Game theory. In this paper, the ideal model that we selected is the Unified Game-based model. Based on Game theory, this research proposes a non-cooperative game model for resource allocation and provides algorithms to compute Nash equilibrium. With the application of Game theory, when Nash equilibrium occurs, each player obtains an optimal strategy that leads to an efficient allocation after considering the opponent’s strategy. Additionally, the Non-dominated Sorting Genetic Algorithm (NSGA-II) is also applied. Using a particular kind of crossover and mutation to create children, this algorithm then selects the following generation using comparisons of crowding distance and nondominated-sorting. The experimental results of this study show the possibility of optimizing resource allocation for emergency management sites. Keywords: Game theory, Nash equilibrium, Unified Game-based Model, NSGA-II algorithm. Keywords: Game theory, Nash equilibrium, Unified Game-based Model, NSGA-II algorithm.

  • Application of Game Theory in trading conflictresolution of global cooperation in economicsbetween member countries in WTO using FairEvolutionary Multiobjective Optimizer (FEMO)

    Application of Game Theory in trading conflictresolution of global cooperation in economicsbetween member countries in WTO using FairEvolutionary Multiobjective Optimizer (FEMO)


    Year: Spring 2022


    Instructor: Dr. Trinh Bao Ngoc


    Students:

    • Nguyen Thi Thanh Huyen
    • Nguyen Duy Anh
    • Vu Thi Bich Phuong
    • Can Thi Mai Anh
    • Nguyen Thi Diem Quynh

    Abstract

    Cooperation between countries and different economies is an inevitable trend for development in all aspects, but contradictions and trading conflicts still exist even though they have been resolved by many methods. This article suggests the use of game theory to resolve conflicts of economic cooperation between countries in the WTO participating in global cooperation. Therefore, the purpose of using game theory is to understand and analyze the behaviour or decisions of global cooperative countries that are one the typical cases of conflict situations. Based on the FEMO [1] algorithm model, it will show the main tensions when cooperating based on trade and protectionist principles, and point out common causes leading to domestic conflicts and conflicts when cooperating between countries’ families. From there, we came up with issues that need to be resolved including unfair competition between economic cooperation partners, the need to use domestic goods and taxes caused by the trade war to minimize failures, aim to solve problems and offer some strategic choices for players who use game theory joining the world trade market.

  • UTILIZE GAME THEORY TO PARTICIPATEIN ACADEMIC COURSES IN UNIVERSITY BYGD3 ALGORITHM

    UTILIZE GAME THEORY TO PARTICIPATEIN ACADEMIC COURSES IN UNIVERSITY BYGD3 ALGORITHM

    June 2022

    by Pham Duc Anh Ta, Hong Nhung Nguyen, Thi Nga Nguyen

    Abstract

    Nowadays, the competition between students when applying for credit on campus has become a rather persistent issue for both the student and universities. Network congestion, the lack of slots in a class, and the cancellation of a class after successful enrollment have led to the fact that students often graduate late or disrupt the registration plan of a semester. Considering that this dilemma requires a balance of benefits for thousands of people, in this case, all the students of a university, this paper aims to solve it using game theory, a branch of mathematics that deals with finding optimal strategies in competitive situations, which relies heavily on the concepts of strategy, opponent modeling, and equilibrium. To find a solution to this issue, we will apply the GDE3 Algorithm because, with our game theory-based registration system, credit registration becomes seamless and painless by incentivizing the students with rewards they will gain upon meeting some conditions. This research provides both students and universities with the optimal solution for successful credit registration in the future.

  • Applications of game theory in deep learning: a survey

    Applications of game theory in deep learning: a survey

    Tanmoy Hazra 1 & Kushal Anjaria2
    Received: 9 June 2021 / Revised: 29 August 2021 / Accepted: 3 January 2022

    The Author(s), under exclusive licence to Springer Science+Business Media, LLC, part of Springer Nature 2022

    Abstract


    This paper provides a comprehensive overview of the applications of game theory in deep learning. Today, deep learning is a fast-evolving area for research in the domain of artificial intelligence. Alternatively, game theory has been showing its multi-dimensional applications in the last few decades. The application of game theory to deep learning includes another dimension in research. Game theory helps to model or solve various deep learning-based problems. Existing research contributions demonstrate that game theory is a potential approach to improve results in deep learning models. The design of deep learning models often involves a game-theoretic approach. Most of the classification problems which popularly employ a deep learning approach can be seen as a Stackelberg game. Generative Adversarial Network (GAN) is a deep learning architecture that has gained popularity in solving complex computer vision problems. GANs have their roots in game theory. The training of the generators and discriminators in GANs is essentially a two-player zero-sum game that allows the model to learn complex functions. This paper will give researchers an extensive account of significant contributions which have taken place in deep learning using game-theoretic concepts thus, giving a clear insight, challenges, and future directions. The current study also details various real-time applications of existing literature, valuable datasets in the field, and the popularity of this research area in recent years of publications and citations.