Nguyễn Trọng Nghĩa-2201040128, Trịnh Huy Thắng-2201040171, Công Trí Thành-2201040166, Phạm Thành Đạt-2201040042, Tô Phương nam-2201040118, Vũ Việt Hoàng-2201040077, Vũ Minh Hạnh-2201040059, Trần Thị Minh Nguyệt-2201040136
Abstract
Countries sharing river basins often find themselves in disputes over water resources, as competition for access to and control over them can lead to conflicts. As industries and farms vied for access, their rivalry led to resource depletion, economic instability, social conflicts, and hindered regional development. Within this context, Game theory (GT) was applied based on various fields such as economic interests, natural resource availability and political status to balance the benefits, promoting win-win scenarios and ensuring long-term collaboration. With the GT and Unified game-based model (UGM), the resolution for water disputes among countries sharing a river basin are facilitated by modeling strategic interactions and offering actionable insights to enhance transboundary water resource management and cooperation. This study integrates the Multi-Objective Evolutionary Algorithm (MOEA) Framework, a platform for solving multi-objective optimization problems, with UGM to address transboundary water allocation. Specifically, the SMPSO algorithm of MOEA frameworks was employed to generate solutions that form a Pareto front, followed by game-theoretic analysis. The aim was to find the Nash equilibrium (NE) that enhances one country’s water resource allocation without affecting the result of any other country.
Keywords: Water resource allocation, Water conflicts, Game theory, SMPSO
- Introduction
1.1. Background
The central challenge lies in sharing water in river basins that cross national borders, leading to tensions between countries such as India and Pakistan over the Indus river. Despite treaties being signed like the Indus Waters Treaty between India and Pakistan, these disputes continue to impact regional stability, economic growth, and security [6]. As global water demand is expected to rise by 55% by 2050, competition for water is anticipated to get worse, and climate change is adding to the problem by causing more frequent droughts [5]. If nations do not work together to manage water effectively, water-scarce regions could see their economies shrink by up to 6% [4]. According to Figure 1, the central challenge lies in sharing water in river basins that cross national borders, often leading to tensions such as between India and Pakistan over the Indus River. Although the Indus Basin is not marked as a high-conflict area in the figure, this case shows that even basins with formal treaties can remain politically sensitive. The dark gray areas indicate basins with weak management that pose political, economic, and environmental risks, while gray-black regions highlight ongoing disputes that threaten food and energy security.

Figure 1: Transboundary Freshwater Dispute Database [30].
To better understand the concerns mentioned above, we analyze the conflicts in population dynamics, socio-economic conditions, and geography in countries sharing a river resources. Countries lacking access to coastlines or navigable rivers often encounter substantial geographical challenges, particularly in ensuring sufficient access to freshwater resources [15]. The water footprint of developed countries increases with above-average consumption patterns and competitive manufacturing, resulting in water management tensions across neighboring areas, where poorer regions are particularly affected by scarcity [11]. Socio-economic status, geographical constrictions, which resulted in environmental instability, are in conflict. Production in both industry and agriculture based largely on water contributed to the loss of soil and the depletion of freshwater [12]. These issues are deeply interconnected, and it is crucial to balance these factors to alleviate conflicts. Figure 2 shows the pressure on water resources across Europe (higher exploitation percentage represents darker color) due to consumption patterns, intended use, and initial impact of seasonal changes.
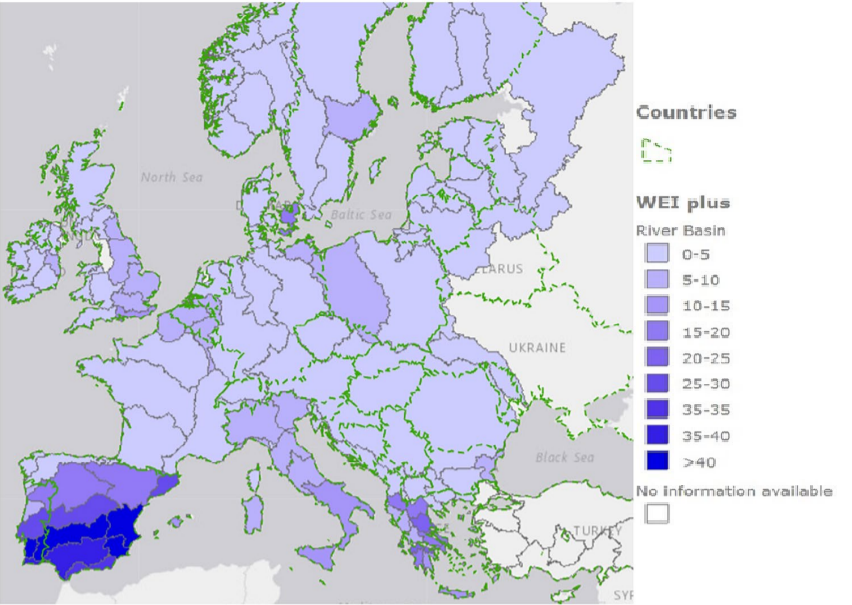 |
| Figure 2: Map of Water Exploitation Index (%) for European countries [41]. |
To address the aforementioned issues, numerous past studies applying optimization models such as linear optimization, mixed-integer linear optimization and multi-objective programming were conducted [40]. These methods were used under the assumption of perfect cooperation between riparian countries, which was often uncertain in transboundary water sharing. Consequently, water allocation outputs from those models could be unrealistic, as they did not consider the strategic interactions between the sharing countries [39]. GT can assess them by defining decision-making in human rationality as a logical game in which players-nations strategically interact to maximize payoff, on expecting other players’ actions [3]. This is most useful in transboundary water allocation, as it models conflicts and identifies cooperative solutions to avoid exploitation of resources [39]. NE is a core aspect of GT, referring to a stable state where no country can improve its outcome by unilaterally changing its strategy. NE, which earned John Nash the Nobel Prize in 1994, is crucial for water allocation as it ensures cooperation and prevents unfair advantage amid growing water scarcity [7]. With NE as a core principle, GT provides a structured framework for analyzing strategic interactions among countries to ensure that water allocation agreements are equitable and stable. By considering the incentives and potential actions of each party, GT helps design agreements that balance national interests with the long-term sustainability of shared water resources.
To achieve efficiency in water resource balancing across countries along river basins, we employ multi-objective evolutionary algorithms (MOEAs), which help resolve conflicts between players’ objectives by generating Pareto-optimal solutions. MOEAs have demonstrated efficacy in addressing multi-stakeholder water allocation problems, as evidenced by Kidanu et al. (2023) [1], who applied them to optimize competing multiple objectives within transboundary water systems. In order to capitalize on the advantages of MOEAs, we recommend Speed-constrained Multi-Objective Particle Swarm Optimization (SMPSO), an improved PSO that has been shown to outperform other MOEAs in discovering Pareto-optimized solutions [2], making it well-suited for transboundary water resource optimization. SMPSO limits particle velocity, which assists in the search for optimal allocation strategies, as demonstrated by Zhou et al. (2024) in [9]. While optimization techniques like SMPSO can help identify efficient solutions, addressing strategic conflicts between countries requires GT to model interactions and develop stable strategy allocations by predicting equilibrium outcomes. By integrating SMPSO optimization capabilities with the cooperative framework UGM, we aim to address the water supply–demand imbalance and enable the equitable and efficient water allocation in the river basin area by identifying optimal trade-offs among competing objectives.
1.2. Related work
The section gives a comprehensive critique of the pioneering work contained in the literature on the topic of water resource allocation. It introduces the contribution and defines the research gaps offering room for further elaboration and enhancement that are critical to fill in the present study. Several methods and frameworks exist in the literature to reach our current body of understanding about the inherent complex dynamics that underlie the distribution of water. But not all have been carried out with regard to their complete effectiveness.
Since the past seven years, various optimization techniques and algorithms have been applied to water resource allocation models with specific emphasis on areas of constrained water. Genetic Algorithms and Evolutionary Models are some of the best research lines recently. For instance, Qin et al. [14] integrated bankruptcy theory and an asymmetric power index to optimize fair transboundary water allocation under scarcity conditions. Similarly, Zhao [18] applied a hybrid GA-simulated annealing algorithm to improve agricultural water use efficiency. Subsequently, Janjua et al. [26] also proposed a three-stage cooperative game model incorporating bankruptcy theory, Nash bargaining, and multi-criteria decision-making for allocating water under scarcity.
Other advanced techniques involved the integration of GT with Particle Swarm Optimization (PSO). Qin et al. [14] addressed transboundary water allocation by incorporating asymmetric power relationships and bankruptcy theory for fair allocation of limited water resources. Mirzaei-Nodoushan et al. [17] contrasted cooperative and non-cooperative game-theoretic policies for transboundary river basins, while Khorshidi et al. [19] employed the integration of agent-based modeling and Game Theory for hierarchical water system management. Tian [16] also showed that game-theoretic methods incorporated with PSO and risk management can conveniently handle uncertainties in water allocation decisions.
Multi-objective optimization techniques continue to play a significant role in water resource management. Wu [27] applied a programming-based approach to address inefficiencies and unsustainability in water systems. Yan [28] optimized water allocation for the upper Hanjiang River Basin in accordance with the “3 Redlines” policy using the NSGA-II algorithm. Hemati and Abrishamchi [25] applied game theory to develop an equitable water allocation model under climate change conditions. These methods contribute to solving sectoral allocation issues, including hydropower, agriculture, and socio-economic trade-offs, as emphasized in the studies by Peretti and Kilinc [21], [20].
| Techniques | Authors | Study/Application | Key contributions |
| Genetic Algorithms(GA) | Janjua et al. in [26] | Water allocation with GT, bankruptcy theory & TOPSIS | Three-stage cooperative model for allocation under scarcity. |
| Qin et al. in [14] | Transboundary water allocation under scarcity | Bankruptcy theory and asymmetric power index for equitable, game-based distribution. | |
| Yin Zhao in [18] | Agricultural water efficiency under global scarcity | Hybrid GA-simulated annealing for improved allocation. | |
| Particle Swarm Optimization(PSO) | Qin et al. in [14] | Transboundary water allocation using power asymmetry | Uses bankruptcy theory and asymmetric index to balance scarcity. |
| Mirzaei-Nodoushan et al. in [17] | Water allocation in transboundary rivers | Game theoretic analysis of cooperative vs non-cooperative solutions. | |
| Khorshidi et al. in [19] | Agent-based and GT modeling for water allocation | Integration of Game Theory into complex system allocation models. | |
| Jiahe Tian in[16] | Uncertainty management in water allocation | Integrated PSO with GT and bankruptcy risk models. | |
| Multi-Objective Optimization | Wenyu Wu in [27] | Efficiency loss and sustainability in water systems | Multi-Objective Optimization programming to minimize inefficiencies. |
| Baowei Yan in [28] | Upper Hanjiang River Basin under “3 Redlines” policy | NSGA-II for policy-compliant water optimization. | |
| Hemati & Abrishamchi in [25] | Game Theory for water allocation under climate change | Game theoretic model for dynamic basin management. | |
| Francesca Peretti, Huseyin Cagan Kilinc in [21,20] | Hydropower, agriculture, and socio-economic balance | Combined optimization for multi-sectoral water conflicts. |
Table 1: Summary of related work and their key contribution
Even with many optimisation techniques, like genetic algorithms (GA), particle swarm optimisation (PSO), hybrid models, index quota methods being widely applied in allocating water resources, their applications tend to aim at computational efficiency and prediction accuracy. These applications are, however, conducted without formally being included in the cooperative decision-making model, whose significance is particular in transboundary water management. As a result, even if such approaches optimize technical use of the resources, they do not succeed in treating incompatible interests or formulating balanced and fair deals between stakeholders. To overcome these obstacles, advanced models using cooperative game theory and negotiation-based mechanisms are needed for more balanced, conflict-sensitive shared water resource solutions.
1.3. Key contributions
The allocation of the transboundary water resources is embedded in competing country interests, unequal socio-economic situations, and the environment. The lack of cooperation between them creates conflicts and inefficiencies, while rising water demand from population growth and economic news increases competition, making the distribution more challenging. To resolve the above challenges, this paper proposes the main questions that need to be solved:
- What key factors should be considered when allocating water resources among countries to ensure equitable and sustainable distribution?
- What systematic approach can be applied to balance transboundary water?
- How to determine the optimal solution for addressing water allocation problems among nations sharing a river basin?
For fair and equitable water distribution between nations, hydrological equity, population requirements, and socioeconomic circumstances influence water demand and sustainability [36]. Legal context and climatic volatility make it difficult, as agreements and varying supply influence choice [37]. Infrastructure, technology, and economic evaluation influence efficiency in water utilization. Ultimately, geopolitical forces, driven by power disparities and past conflicts, shape cooperation or conflict between nations [38]. These factors were identified through a comprehensive review of existing literature and case studies on transboundary water conflicts, including studies on international water disputes and data from organizations addressing water management. Balancing all of these factors is essential to achieving equitable transboundary water administration.
To balance cross-border water distribution, Unified game-based models such as the Multi-Objective Game-Theoretic Model, Nash Bargaining Model, and Multi-Agent System Model integrate hydrological data, economic and social factors, legal regulations, environmental sustainability measures, and multi-objective optimization. These comprehensive models ensure that water allocation remains both equitable and efficient while addressing geopolitical complexities. By balancing national interests with collective resource management, the model fosters sustainable cooperation and long-term stability in transboundary water-sharing agreements.
SMPSO is a robust approach to optimizing transboundary water allocation by game-theoretic exploration of trade-offs between economic, environmental, and social objectives. It helps find NE by reducing trial and error search to identify stable and Pareto-optimal solutions in which no nation can make a better decision by unilaterally deviating. By integrating SMPSO with cooperative models, decision-makers can systematically acquire NE solutions maximizing overall benefits and promoting long-term cooperation in water supply.
Using a Unified Game-based model integrating Game theory and SMPSO algorithm, this study offered a novel approach to the complex problem of water distribution among river basin-sharing countries. Our central contributions are:
- Modelling strategic interactions between countries in transboundary water allocation: Game theory approach was used to analyze the strategic interactions between countries and ensure equitable distribution that satisfies both basin-wide and national goals through Nash equilibrium.
- The extension of a Unified Game-based model: The model integrated both international conflict resolution and long-term environmental effects analysis to enhance decision-making in water resource allocation.
- Resolving multi-party conflicts between riparian countries’ objectives: SMPSO, an algorithm within the MOEA framework, was utilized to optimize the multi-objective aspect of the problem.
Also, the strategies developed for river basin water distribution can be used to solve other issues in the area of water distribution.
II. Problem definitions
The issue was about Transboundary Water Resource Distribution Optimization (TWRDO) within an international river basin where a River Basin Organization (RBO) controlled the allocation of water among the riparian countries. This scenario was captured mathematically by a set P of riparian countries where P = {P1, …, PM} with each Pi ( 0iM, M N) being a riparian country. The RBO, P0, was a special player that guaranteed fair allocation of water without using any itself so as not to let any country dominate the game. Each riparian country had a set of strategies S , on the other hand, the RBO also had a custom strategy set S0 that specified how TWRDO can be solved with sustainability measures. The goal was to complete the water allocation in a way that was fair, efficient, and sustainable from both ecological and geopolitical perspectives.
The dataset consists of three nations denoted by M={m1,m2,m3}. Each nation has different characteristics: water productivity, water allocation cost and ecosystem restoration cost. River basin commissions can decide the costs of ecosystem restoration and allocate water strategically to limit negative impacts on ecosystems and ensure long-term ecological sustainability.
| Nations | Productivity(USD/m3) | Allocation cost(USD/m3) | Ecosystem restoration(USD) | Water allocated (m3) |
| m1 | 4.10 | 1.00 | 350,000 | 200,000 |
| m2 | 5.50 | 1.50 | 200,000 | 400,000 |
| m3 | 3.80 | 0.90 | 500,000 | 250,000 |
Table 2: Example data of water-related characteristics
The player types examined by Yu & Lu in [31], Yu in [32], and Bi in [13] reveal crucial traits needed for effective optimization in cooperative scenarios. The characteristics of each country within the river basin were defined by multiple factors, including: GDP changes Ei, ecological degradation Ti, area of food production area Si, water distributed Qi and military power Mi. The economic impact Ei was measured through GDP changes resulting from water allocation, while the financial burden of ecological degradation was denoted as Ti. Food production area, represented by Si was assessed based on the area of land used for essential agricultural production . The amount of water distributed Qi and the military power index Mi were also considered in decision-making. We also contributed 2 factors: Ci ( Climate resilience) [4] and Fi ( Feasibility index) [43] in our paper. Including them will enhance the model’s realism, two critical dimensions often overlooked in technical optimization models but essential for the practical implementation of water-sharing strategies. Although both are challenging to quantify precisely, they can be estimated through indirect indicators, such as historical response to drought events for Ci, or expert-based scoring and policy review for Fi.
To balance national interests and regional sustainability, riparian countries adopted different strategies. Retaining water often increased economic output Ei and water security Qi but reduced food production area Si and ecological balance Ti, while releasing water enhanced food production area Si and reduced ecological degradation Ti, but often led to lower economic returns Ei. Infrastructure and industrial choices also played a role; dams and high-profit industries boosted Ei but raised environmental degradation and military tension (Ti, Mi), whereas eco-friendly approaches supported long-term sustainability. As a contribution of this study, two new factors were introduced: Ci, measuring a country’s ability to cope with long-term water variability, and Fi, reflecting the institutional and public support for each strategy. Together, these components offer a more comprehensive evaluation of national preferences in cooperative water allocation. In addition to the countries’ strategies, the RBO maintains its own recommendation space S0, which includes coordinated allocation plans or cooperative rules proposed to guide the system toward equitable outcomes.
Based on the characteristics and strategies of each player mentioned above, we have established the following tables summarized to make it easier to follow.
| Riparian countries | Strategies |
| GDP changes from water allocation (Ei) Financial impact of ecological degradation on a country (Ti) The military power of country i (Mi) The area of food security production in a country (Si) Amount of water distributed to a country (Qi) Climate resilience (Ci) Feasibility index (Fi) | Retain water (Qi, Si, Ei) Release more water (Si, Ei, Ti) Build dams, reservoirs (Qi, Ei, Ti) Invest in recycling plants (Ti, Mi, Si, Ci) Build polluting manufactures (Ei, Ti, Mi, Fi) Maintain environmental safety (Ti,Mi,Ei, Fi) Expand high-water-usage crops (Ei, Qi, Ti, Ci ) Shift to water-efficient crops (Qi, Ti, Mi, Ei, Ci, Fi) |
Table 3: Summary of players, strategies and their corresponding characteristics
Each riparian country in the river basin faces a multi-objective decision problem shaped by national characteristics, including economic benefits Ei, ecological impact Ti, food security Si, water allocation Qi, military sensitivity Mi, climate resilience Ci, and policy feasibility Fi. These characteristics directly influence the country’s strategic objectives. For example, a country prioritizing economic growth may focus on maximizing Ei and Qi, while another with fragile ecosystems may aim to reduce Ti and strengthen Ci. Countries with strong governance may emphasize feasible policies Fi, even at the cost of short-term returns. As a result, each player evaluates strategies differently based on how well they align with its own characteristic-driven goals, which creates inherent conflicts and trade-offs in regional water allocation.
Figure 3: Solution Structure for Water Allocation Optimization
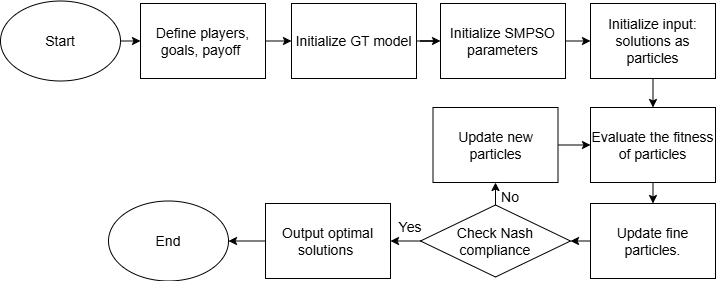
This flowchart outlines the approach to optimizing the distribution of water resources. It begins with identification of key participants, objectives, and benefits, followed by setting up a structured model and necessary parameters. Initial drafts of possible solutions are generated, followed by a determination of effectiveness. The process continues to improve the solutions by several cycles. When an allocation considered fair and efficient is achieved, the solution is tested and released.
III. Methods
3.1 Existing model
Unified
The Unified Game-based Model (UGM) effectively resolves multi-party conflicts such as transboundary water disputes. In this framework, the RBO acts as the leader, while riparian countries (followers) adjust strategies. The model promotes equitable outcomes via Nash equilibrium by analyzing strategy sets S and S0. To formally represent all key components of the allocation framework, we define a cooperative game model G, which includes the set of players, their available strategies, payoff functions, and conflict structure. A typical example is Trinh’s multi-round procurement model [34], which extends the Unified Game-Based Model by specifying players, strategy sets, payoff functions, and conflict relations. In this model, contractors (players) compete over successive rounds under a project owner’s coordination (leader), showcasing UGM’s strength in modeling dynamic, multi-stage negotiations
3.2 Model for TWRDO
We utilize the UGM structure by mapping its abstract roles into concrete components in our model. S0 is instantiated as the RBO, responsible for guiding cooperative behavior rather than pursuing its own utility. Riparian countries become strategic agents, each with custom objectives and strategy sets reflecting national characteristics. From this base, we developed a payoff system and conflict measure tailored to water-sharing, enabling the model to resolve trade-offs through equilibrium-based decision-making. This transition from abstract UGM to a structured allocation model forms the core of our contribution.
G = 〈{P0,P}, {S0,S}, {u0,ui}, Rc〉 (1)
Where :
- P0: The River Basin Organization (special player), which provides strategy recommendations without consuming water.
- P = {Pi, .. ,PM} Riparian countries (normal players), where 0 i M, M is the total number of riparian countries, and M ∈ N.
- S0, S = {Si, .. ,SM} : Strategy sets for the RBO and each riparian country.
- u0, ui : Payoff functions of the RBO and country Pi, ui is each country’s benefit from allocation, while u0 = ui represents the RBO’s goal of maximizing collective welfare.
- Rc: The conflict vector space represents the level of conflicts between at least two riparian countries.
In this model, a Nash equilibrium is defined as a set of strategies where no player can unilaterally improve their payoff, given the strategies of the other players. It represents a stable state where each country’s strategy is optimal, ensuring strategic stability under the RBO’s coordination. To allocate river basin water resources among riparian countries, we introduced a strategy derived from the characteristics and priorities identified in the problem definition, including GDP change, ecological degradation, and water demand. This strategy balances economic efficiency, ecological sustainability, and geopolitical stability, enabling the model to simulate cooperative water allocation decisions.
Divide based on the watershed area
Qi=QRiAt (2)
Where:
- Qi: Amount of water distributed to country i. (m3)
- Q: The total amount of water resources in the basin. (m3)
- At: The total watershed area of the basin. (km2)
- Ri: The watershed area within each basin country. (km2)
In our game-theoretic framework, conflict space Rc represents the degree of disagreement between riparian countries’ strategic preferences. Each point in Rc indicates unequal payoffs that may cause negotiation instability or tension. For example, consider two countries p1and p2 with respective strategy sets that lead to normalized payoffs u1 = 0.9 and u2 = 0.4. The large discrepancy between their payoffs (i.e.,u1 – u2 = 0.5) contributes to the conflict space Rc, indicating a high potential for disagreement. By minimizing this space through cooperative strategy adjustment, the model seeks to approach equilibrium and fairness.
We define two distinct payoff functions corresponding to the two types of players: the riparian countries and the RBO.
- Payoff Function for Riparian Countries
Each riparian country Pi selects a strategy, which is evaluated based on multiple national objectives including Einorm, Tinorm, Qinorm, Sinorm, Minorm, Cinorm, Finorm
Each follows the general form:
Xinorm=Xi – XminXmax – Xmin (3)
Where Xnorm is the normalized value of X , Xi is the original value of the variable X, and Xmin, Xmax are the observed minimum and maximum values respectively across all countries. In cases where Xmax =Xmin , indicating no variation in the variable, the normalized value is defined as Xnorm = 0 to avoid division by zero and reflect the absence of differentiation among countries. The utility function for each country is then defined as:
ui = Einorm- Tinorm+ Qinorm+ Sinorm- Minorm+ Cinorm+Finorm (4)
- Payoff Function for the RBO (Special Player)
The River Basin Organization does not act to maximize its own utility, but rather serves as a strategic coordinator. Its objective is to promote fair and balanced outcomes among all participants. Therefore, its utility is defined as the sum of the utilities of all riparian countries:
u0 =iMui (5)
This formulation ensures that the RBO’s objective is aligned with overall system efficiency and cooperation. By maximizing u0 , the model seeks outcomes where all countries benefit to a reasonable extent, while reducing the likelihood of unilateral advantage or conflict.
The model enhances realism by incorporating climate resilience and policy acceptability, allowing for more practical and sustainable solutions. Structurally, the payoff functions use normalized components, ensuring consistent scaling and efficient evaluation. This design benefits the SMPSO algorithm by simplifying multi-objective exploration and enabling faster convergence. It also prepares the problem space for the algorithmic approach in the next section, supporting scalable and balanced water allocation decisions.
3.3. Algorithm
NP-hard problems are regarded as some of the most computationally intensive challenges, as there are no known polynomial-time algorithms that can ensure an optimal solution for them [42]. Transboundary water allocation was a complex NP-hard problem, characterized by the exponential growth of possible solutions as the number of stakeholders increased. For N stakeholders (N N), the number of possible coalitions was 2N-1, making precise computation infeasible due to the vast solution space. This complexity was further intensified by competing objectives, such as optimizing Ei, minimizing Ti, satisfying Qi, balancing Si, and considering Mi. A hybrid approach combining the SMPSO algorithm with a Cooperative game model efficiently explores the solution space, optimizing multi-dimensional objectives while ensuring fairness, stability, and practical outcomes.
The SMPSO algorithm is a solution space as a swarm of particles, each representing one possible solution for TWRDO. Particles update their positions and speeds iteratively guided by personal best pi and global best gi through payoff functions uiand u0. The time complexity increases exponentially with the number of players, reaching O (2n . jn) due to the combinatorial growth of coalitions and strategy profiles. In this study, SMPSO is configured with 6 particles, 100 iterations, a mutation probability of 0.1, and velocity bounds of [–0.6, 0.6], ensuring computational efficiency for the problem scale. The mechanism of the speed constraint prevents excessive movement and keeps the balance between exploration and exploitation. Normalization of multi-objectives resolves possible conflicts among objectives, and diversity-preserving strategies provide a way to avoid pre-convergence. By processing the particles in parallel, SMPSO can efficiently explore high-dimensional spaces and converge towards Pareto-optimal solutions, hence providing an effective method to solve NP-hard problems within computational feasibility.
A chromosome in the SMPSO algorithm is a sequence of real-valued genes, where each gene represents a decision variable for one riparian country. For example, the figure below shows a sample chromosome:

Figure 4: Sample chromosome encoding
In this chromosome, each box represents a gene, and the values {25, 5, 10, 15, 20, 25} indicate the selected strategy in dealing with others for each of the six riparian countries. These values are decision variables each representing how a country chooses to interact with others, such as through water allocation or managing ecological costs. Together, the genes form a complete strategy profile, allowing evaluation of outcomes when all countries follow the specified strategies.
To represent potential Nash equilibrium strategies in the SMPSO algorithm, each particle in the swarm is modeled as a chromosome containing real-valued genes. Each gene encodes a decision variable such as water allocation, ecological cost, or strategic influence for a riparian country. In our formulation, the chromosome size is 6, corresponding to the number of riparian countries considered in the model. A complete chromosome captures a multi-country strategy profile, enabling the algorithm to evaluate whether a given combination satisfies the NE condition, where no country benefits from changing its strategy unilaterally.


Figure 5: The mutation process of choosing chromosome
Where :
- The six genes represent the chromosome for a set of Riparian countries P = {P1, P2, P3, P4, P5, P6}.
- Each element is the percentage of water allocated to a specific country from the total available water in the river basin.
The fitness function evaluates solution quality by balancing fairness and total social benefit. Let ui, uj be the payoffs of countries i and j, and N the number of riparian countries. The total payoff u0 = i = 1Nuireflects the overall system efficiency. The numerator 1 i < j N ui – uj measures inequality among countries, while the denominator N u0 normalizes this by total benefit. A smaller fitness value F indicates more equal and efficient water allocation. The function is defined as:
F =1000* 1 i < j N ui – uj N u0 (6)
The SMPSO algorithm then updates the strategies in the chromosomes, helping to find the best way to distribute water among the countries. The flowchart below demonstrates how the SMPSO
algorithm works to find solutions for water distribution among riverine countries:

Figure 6: Flowchart of how the SMPSO algorithm works for the problem
The flow chart describes the following steps to solve the problem. The algorithm first initializes a swarm particle with random positions p0 and an empty leader archive to store the best discovered particle, also known as the best solution. In the first generation (i=0), the particles velocity are set to 0 (v0=0), as i increase, v are updated to discover new position (p). Max generation (Imax) is a pre-defined iteration, in each generation every particle is calculated and assessed based on their fitness function result to discover the potential Gbest. Then the Gbest iteratively compare candidates by better positioned particles. The generation count stops and returns the leader archive result when it reaches Imax.

Figure 6: Pseudocode of SMPSO algorithm in water allocation problem
The pseudocode above outlines a modified SMPSO algorithm for transboundary water allocation. Inputs include M, N, Genmax, strategy sets, constraints (e.g., water balance), and Rc. The algorithm generates Gbest that balances fairness and conflict reduction. It initializes particles, evaluates fitness based on payoff vectors, updates positions and velocities, applies constraints, and introduces mutation. After all generations, the best solution is selected based on utility and minimal conflict.
IV. Result
This section introduces the experimental framework for river basin nations to maximize transboundary water allocation. Our approach combines the SMPSO algorithm with Game Theory to identify balanced, efficient water allocation strategies that solve the conflicting needs and potential disagreements between nations. The configuration we used in this section includes an AMD Ryzen 5 7530U with Radeon Graphics CPU, 6 CPU Physical cores, 12 CPU Logical cores, 15.4 GiB of Total Physical Memory, and Windows 11 operating system. The table below includes the necessary information about the algorithm parameters.
| Experiment parameters | Maximum generations(gmax) | Mutation probability(Pm) | Speed constraints(vmin, vmax) | Payoff weight(wi) |
| value | 100 | 0.1 | [-0.6, 0.6] | 1 |
Table 4: Experiment parameters for SMPSO
Table 4 summarizes the key variables used in the SMPSO algorithm, including the number of participating countries, the number of optimization iterations, mutation rate, velocity bounds for particle movement, and the payoff weighting. These variables collectively guide the algorithm’s search process and convergence towards equitable and efficient water allocation outcomes.
In this context, a dataset comprising weighted values of various factors influencing the allocation of water resources among countries sharing the Lancang-Mekong [13]. Our sample dataset, which was referenced from [13] and the SIPRI Military Expenditure Database, includes information on 6 riparian countries, each considering two distinct strategies. Each country is characterized by 7 metrics, including GDP changes, ecological impact, food security area, watershed area, and water rights. Table 5 below is a partial representation of the dataset for the first four countries:
| Country | Strategy | Einorm | Qinorm | Sinorm | Tinorm | Minorm | Cinorm | Finorm |
|---|---|---|---|---|---|---|---|---|
| China | Strategy 100 | 0.673 | 0.508 | 0.930 | 0.265 | 0.637 | 0.929 | 0.956 |
| Cambodia | Strategy 58 | 0.291 | 0.642 | 0.601 | 0.511 | 0.391 | 0.27 | 0.34 |
| Laos | Strategy 59 | 0.817 | 0.899 | 0.230 | 0.613 | 0.754 | 0.100 | 0.273 |
| Vietnam | Strategy 100 | 0.595 | 0.992 | 0.077 | 0.631 | 0.301 | 0.429 | 0.216 |
| Thailand | Strategy 100 | 0.543 | 0.863 | 0.279 | 0.584 | 0.972 | 0.373 | 0.814 |
| Myanmar | Strategy 34 | 0.175 | 0.299 | 0.896 | 0.481 | 0.631 | 0.210 | 0.765 |
Table 5: A part of the dataset for riparian countries.
With the data set partially provided in Table 5, the results statistics are shown in Table 6, and Figure 8. The optimal solution for each country with the payoff value respectively by using SMPSO algorithm is shown in Table 6, demonstrating the relationship between profit and loss among countries.
| Player | Strategy number | Einorm | Tinorm | Qinorm | Sinorm | Minorm | Cinorm | Finorm | Payoff value |
| China | 100 | 0.293 | 0.406 | 0.740 | 0.319 | 0.145 | 0.004 | 0.102 | 1.05 |
| Cambodia | 58 | 0.240 | 0.525 | 0.394 | 0.010 | 0.559 | 0.407 | 0.366 | 1.02 |
| Laos | 59 | 0.272 | 0.665 | 0.002 | 0.058 | 0.604 | 0.240 | 0.776 | 0.98 |
| Myanmar | 100 | 0.412 | 0.811 | 0.178 | 0.390 | 0.523 | 0.099 | 0.633 | 1.00 |
| Vietnam | 100 | 0.010 | 1.070 | 1.004 | 0.663 | 0.678 | 0.750 | 0.092 | 0.97 |
| Thailand | 34 | 0.041 | 0.825 | 0.386 | 0.194 | 0.564 | 0.671 | 0.076 | 1.01 |
Table 6: Result of the experiment
The table below supports the comparison between algorithms by highlighting SMPSO’s performance through its fitness values across iterations over time (in seconds). Moreover, the evolution of fitness values over time illustrates the distinct progression patterns of each algorithm.
| Iteration | Fitness value/Time(sec) | ||||
| VEGA | NSGAII | NGSAIII | SMPSO | OMOPSO | |
| 1 | 7.2/5.08 | 6.25/5.1 | 9.5/5.17 | 2.96/5.06 | 7.37/5.06 |
| 2 | 6.34/5.11 | 5.29/5.11 | 8.09/5.28 | 6.67/5.04 | 4.36/5.04 |
| 3 | 6.98/5.11 | 6.39/5.08 | 10.3/5.22 | 5.85/5.03 | 1.47/5.0 |
| 4 | 8.4/5.08 | 6.74/5.17 | 9.05/5.25 | 7.19/5.04 | 2.61/5.06 |
| 5 | 6.4/5.07 | 5.16/5.08 | 12.03/5.24 | 5.26/5.05 | 9.48/5.05 |
| 6 | 7.98/5.07 | 7.3/5.08 | 10.12/5.22 | 7.01/5.02 | 13.77/5.0 |
| 7 | 7.16/5.1 | 2.69/5.04 | 8.64/5.16 | 7.54/5.03 | 4.95/5 |
| 8 | 8.34/5.09 | 3.75/5.13 | 10.95/5.22 | 8.04/5.05 | 5.62/5.03 |
| 9 | 7.1/5.11 | 6.32/5.02 | 11.5/5.08 | 8.64/5.02 | 4.81/5.01 |
| 10 | 7.07/5.09 | 7.05/5.02 | 10.51/5.21 | 5.51/5.03 | 4.23/5.04 |
Table 7: Comparison in performance of different algorithms
balanced water allocation solutions
The figure 8 below clearly illustrates the relationship between fitness value and runtime of the SMPSO algorithm across iterations. The red bars show significant variation in fitness values, while the blue line indicates that runtime remains relatively stable. This visualization effectively highlights how solution quality fluctuates more than computational cost. The use of dual axes allows easy comparison, emphasizing that higher fitness does not always require longer runtime. Overall, the chart provides a concise and intuitive view of SMPSO’s performance in both efficiency and effectiveness.

Figure 8: The correlation between fitness value and runtime for SMPSO algorithms
Figure 9 below shows the runtime comparison of different optimization algorithms (VEGA, NSGAII, NSGAIII, SMPSO, and OMOPSO) using a line chart. The chart displays the computational time of each algorithm with corresponding iterations.

- Iteration1 b) Iteration 2


c) Iteration 3 d) Iteration 4
Figure 7: Comparison of runtime (in second) of different algorithms
Figures 8 and 9 compare the fitness values and runtimes of VEGA, NSGA II, NSGA III, SMPSO, and OMOPSO across ten trials in solving multi-objective optimization problems. SMPSO demonstrated strong overall performance with fitness values ranging from 2.96 to 8.64, and runtimes consistently maintained between 5.02 and 5.08 seconds. Although a slight dip occurred in trial 1, SMPSO’s fitness remained stable in most trials. VEGA showed moderately high fitness values with peaks above 8.4 in trials 4 and 8, but its performance was less stable. NSGA III reported the highest fitness values overall, surpassing 12.03 in trial 5, and its runtime also remained highest in five algorithms, about 5.2 seconds in most of the trials. NSGA II displayed more fluctuation in fitness, dropping to 2.69 in trial 7, while keeping a relatively narrow runtime range between 5.02 and 5.17 seconds. Among the algorithms, SMPSO stood out for delivering consistently low runtimes and competitive fitness levels, making it a reliable and efficient option for multi-objective optimization tasks.
V. Discussion
Among the evaluated optimization algorithms, VEGA, NSGA-II, NSGA-III, OMOPSO, and SMPSO, SMPSO consistently achieved superior performance, with the shortest average runtime of 5.02 seconds and lowest average fitness value of 6.47. These findings align with Chen [2], emphasizing SMPSO’s ability to solve complex multi-objective problems like transboundary water management with stable convergence and low runtime.
The experiment revealed that SMPSO consistently outperformed the other algorithms across multiple trials, achieving a minimum fitness value of 2.96 and showing the narrowest variance in results. In contrast, NSGA-III produced fitness values up to 12.03, with greater instability between runs. Interestingly, while NSGA-III and VEGA are often favored in multi-objective optimization, they underperformed in both precision and consistency when applied to this real-world water allocation context. These outcomes confirm Chen et al. [2]’s conclusions about SMPSO’s effectiveness under complex trade-offs. Moreover, by embedding a game-theoretic framework, the model replicated strategic negotiation patterns among countries, similar to the cooperative mechanisms explored by Bi et al. [13] and Tian et al. [16], reinforcing the model’s real-world applicability.
Despite its promising results, the study has limitations. The use of a simplified dataset may not capture the full socio-political and hydrological complexities of real-world river basins. Future research should integrate real-time hydrological data, support dynamic and stochastic conditions, and consider non-cooperative behaviors. Enhancing the model’s responsiveness to political, legal, and environmental uncertainties would improve its practical relevance.
VI. Conclusion
This paper considers the difficulties of allocating water resources among countries sharing a river basin, which is increasingly complex due to competing demand and water scarcity. Our method for efficient water distribution utilizes SMPSO within a cooperative game model, allowing the balance of multiple factors in riparian nations. This method enables optimal negotiation outcomes among countries, owing to the success depends on accurately defining the objectives and constraints involved. Applying this method, the paper introduces an approach that can effectively balance the competing economic and ecological benefits associated with water resource allocation. At the same time, it emphasizes minimizing potential conflicts and promoting cooperation among the countries that share a river basin. Experimental results demonstrated that SMPSO outperformed other algorithms in the multi-objective optimization problems, with stable fitness values and efficient runtimes. Among the different algorithms discussed in the study, SMPSO stood out as a reliable and sustainable solution that can be effectively applied to the resource distribution field. This research contributes to water management by providing a different approach for equitable distribution based on negotiations through many conflict multi-objective elements. It enhances decision-making in sectors where water allocation is critical to both regional cooperation and long-term sustainability.
References
[1] R. A. Kidanu, M. Cunha, E. Salomons, and A. Ostfeld, “Improving Multi-Objective Optimization Methods of Water Distribution Networks,” Water, vol. 15, no. 14, p. 2561, Jul. 2023, doi: 10.3390/w15142561.
[2] Chen, F., Liu, Y., Yang, J., Liu, J., & Zhang, X. (2024, May). A multi-objective particle swarm optimization with a competitive hybrid learning strategy. In Complex & Intelligent Systems. Springer. doi: 10.1007/s40747-024-01447-7
[3] Ting, C. H. E. N., En, X. U., Haowen, W. A. N. G., JIANG, N., & Qian, W. U. (2023,
September). Application of Game Theory in Distribution Networks. In 2023 International
Conference on Management Innovation and Economy Development (MIED 2023) (pp.
394-405). Atlantis Press. doi: 10.2991/978-94-6463-260-6_51
[4] World Bank. (2016). High and Dry: Climate Change, Water, and the Economy. Washington, DC: The World Bank. https://openknowledge.worldbank.org/server/api/core/bitstreams/5bf39931-836c-54da-953f-15d8330d87d3/content
[5] Consequences, T. (2012). OECD environmental outlook to 2050: the consequences of inaction. Int J Sustain High Educ, 13. doi: 10.1787/9789264122246-en
[6] World Bank. (2018). (n.d.). Fact Sheet: The Indus Waters Treaty (1960) and the World Bank. Retrieved October 25, 2024. https://www.worldbank.org/en/region/sar/brief/fact-sheet-the-indus-waters-treaty-1960-and-the-world-bank
[7] Mirzaei-Nodoushan, F., Bozorg-Haddad, O., & Loáiciga, H. A. (2022, March). Evaluation of cooperative and non-cooperative game theoretic approaches for water allocation of transboundary rivers. In Scientific Reports, 12, 4385. Nature Publishing Group. doi: 10.1038/s41598-022-07971-1
[8] Keshavarzzadeh, A. H. (2022). Optimized water allocation in persistent severe climatic conditions: A novel metaheuristic approach. Water Research, 224, 119072. doi:10.1016/j.watres.2022.119072
[9] Zhou, M., Sun, D., Wang, X., Ma, Y., Cui, Y., & Wu, L. (2024, April). Multi-objective optimal allocation of water resources in Shule River Basin of Northwest China based on climate change scenarios. In Journal of Hydrology, 633, 129330. Elsevier. doi: 10.1016/j.agwat.2024.109015
[10] Schmeier, S. (2021). International water law principles in negotiations and water diplomacy. doi: 10.1017/aju.2021.21
[11] Chen, W., Kang, J. N., & Han, M. S. (2021, June). Global environmental inequality: Evidence from embodied land and virtual water trade. In Science of the Total Environment, 781, 146722. Elsevier. doi: 10.1016/j.scitotenv.2021.146992
[12] Panagoulia, D., & Zisopoulou, K. (2021, June). An in-depth analysis of physical blue and green water scarcity in agriculture in terms of causes and events and perceived amenability to economic and policy interventions. In Water, 13(12), 1693. MDPI. doi: 10.3390/w13121693
[13] Bi, F., Zhou, H., Zhu, M., & Wang, W. (2022). Economic benefit evaluation of water resources allocation in transboundary basins based on particle swarm optimization algorithm and cooperative game model—A case study of Lancang-Mekong River Basin. PloS one, 17(7), e0265350. doi: 10.1371/journal.pone.0265350
[14] J. Qin, X. Fu, X. Wu, J. Wang, J. Huang, X. Chen, J. Liu, and J. Zhang, “Transboundary Water Allocation under Water Scarcity Based on an Asymmetric Power Index Approach with Bankruptcy Theory,” Water, vol. 16, no. 19, p. 2828, Sep. 2024, doi: 10.3390/w16192828.
[15] Indriyani, Rachma. (2017). The Interplay Between Laos as Landlocked State and its Surrounding Coastal States. Yustisia Jurnal Hukum. 6. 10.20961/yustisia.v6i2.12534. Doi: 10.20961/yustisia.v6i2.12534.
[16] Tian, J., Yu, Y., Li, T., Zhou, Y., Li, J., Wang, X., & Han, Y. (2022). A cooperative game model with bankruptcy theory for water allocation: a case study in China Tarim River Basin. Environmental Science and Pollution Research, 29(2), 2353-2364. doi: 10.21203/rs.3.rs-439945/v1
[17] F. Mirzaei-Nodoushan, O. Bozorg-Haddad, and H. A. Loáiciga, “Evaluation of Cooperative and Non-Cooperative Game Theoretic Approaches for Water Allocation of Transboundary Rivers,” Scientific Reports, vol. 12, no. 1, p. 3991, 2022. [Online]. Available: doi: 10.1038/s41598-022-07971-1
[18] Zhao, Y., Li, G., Li, S., Luo, Y., & Bai, Y. (2024). A Review on the Optimization of Irrigation Schedules for Farmlands Based on a Simulation–Optimization Model. Water, 16(17), 2545. doi: 10.3390/w16172545
[19] M. S. Khorshidi, M. R. Nikoo, G. Al-Rawas, N. Bahrami, M. Al-Wardy, N. Talebbeydokhti, and A. H. Gandomi, “Integrating Agent-Based Modeling and Game Theory for Optimal Water Resource Allocation within Complex Hierarchical Systems,” Journal of Cleaner Production, vol. 482, p. 144164, 2024. [Online]. Available: doi: 10.1016/j.jclepro.2024.144164
[20] Kilinc, H. C. (2022). Daily Streamflow Forecasting Based on the Hybrid Particle Swarm Optimization and Long Short-Term Memory Model in the Orontes Basin. Water, 14(3), 490. doi: 10.3390/w14030490
[21] Peretti, F.; Menapace, A.; Righetti, M. (2024). Optimising Water Allocation for Combined Irrigation and Hydropower Systems. Engineering Proceedings, 69, 66. doi: 10.3390/engproc2024069066
[22] Woldeyohanes, T., Kuhn, A., Heckelei, T., & Duguma, L. (2021). Modeling Non-Cooperative Water Use in River Basins. Sustainability, 13(15), 8269. doi: 10.3390/su13158269
[23] Adama, G. J., Jimoh, D. O., & Otache, M. Y. (2020). Optimization of irrigation water allocation framework based on genetic algorithm approach. doi:10.4236/jwarp.2020.124019
[24] Gebre, S. L., Cattrysse, D., & Van Orshoven, J. (2021). Multi-criteria decision-making methods to address water allocation problems: A systematic review. Water, 13(2), 125. doi: 10.3390/w13020125
[25] H. Hemati and A. Abrishamchi, “Water Allocation Using Game Theory under Climate Change Impact (Case Study: Zarinehrood),” Journal of Water and Climate Change, vol. 12, no. 3, pp. 759–771, 2021. [Online]. Available: https://doi.org/10.2166/wcc.2020.153.
[26] S. Janjua, D.-A. An-Vo, K. Reardon-Smith, and S. Mushtaq, “A Three-Stage Cooperative Game Model for Water Resource Allocation Under Scarcity Using Bankruptcy Rules, Nash Bargaining Solution and TOPSIS,” Water Resources Management, 2025. [Online]. Available: doi: 10.1007/s11269-025-04123-8
[27] Wu, W., Zhao, X., Zhang, X., Wu, X., Zhao, Y., & Guo, Q. (2024, March). An ordered multi-objective fuzzy stochastic approach to sustainable water resources management: A case study from Taiyuan City, China. In Water Supply, 24(3), 865–880. IWA Publishing. doi: 10.2166/ws.2024.035
[28] Yan, B., Jiang, H., Zou, Y., Liu, Y., Mu, R., & Wang, H. (2022). An integrated model for optimal water resources allocation under “3 Redlines” water policy of the upper Hanjiang river basin. Journal of Hydrology: Regional Studies, 42, 101167. doi:10.1016/j.ejrh.2022.101167
[29] Zhang, D., Xie, X., Wang, T., Wang, B., & Pei, S. (2022). Research on water resources allocation systems based on rational utilization of brackish water. Water, 14(6), 948. doi: 10.3390/w14060948
[30] Ganoulis, J., Fried, J.(2018). Transboundary water conflicts and cooperation. Transboundary Hydro-Governance: From Conflict to Shared Management, 55-76. doi: 10.1007/978-3-319-78625-4_3
[31] Yu, S., & Lu, H. (2018). An integrated model of water resources optimization allocation based on projection pursuit model–Grey wolf optimization method in a transboundary river basin. Journal of Hydrology, 559, 156-165. doi: 10.1016/j.jhydrol.2018.02.033
[32] Yu, Y., Tang, P., Zhao, J., Liu, B., & Mclaughlin, D. (2019). Evolutionary cooperation in transboundary river basins. Water Resources Research, 55(11), 9977-9994. doi: 10.1029/2019WR025608
[33] Jeong, G., & Kang, D. (2021). Hydro-Economic Water Allocation Model for Water Supply Risk Analysis: A Case Study of Namhan River Basin, South Korea. Sustainability, 13(11), 6005. doi: 10.3390/su13116005
[34] Trinh, B. N., Thang, H. Q., Nguyen, X. T., Luong, P. C., & Ho, N. K. (2019, September). Applying a Unified Game-Based Model in a Payment Scheduling Problem and Design of Experiments Using MOEA Framework. In SoMeT (pp. 55-68). doi:10.3233/FAIA190038
[35] Gerlak, A. K., & Haefner, A. (2017). Riparianization of the Mekong River Commission. Water International, 42(7), 893–902. doi: 10.1080/02508060.2017.1376267
[36] Lu, Y., Ma, Z., Wang, T., Xie, X., & Gu, Y. (2022). Development of a water resource allocation model based on the dynamic exploitable amount of groundwater and its application in Jinghe County, Xinjiang. Frontiers in Environmental Science, 10, 946072. doi: 10.3389/fenvs.2022.946072
[37] Asl-Rousta, B., & Mousavi, S. J. (2025, February). Bankruptcy rules and sustainable water management: A MODSIM–NSGA-II simulation multi-objective optimization framework for equitable transboundary water allocation. In Environmental and Sustainability Indicators, 18, 100269. Elsevier. Retrieved from https://doi.org/10.1016/j.indic.2025.100648
[38] X. Wu, W. He, L. Yuan, R. Li, Y. Qi, D. Yang, D. M. Degefu, and T. S. Ramsey, “Two-stage water resources allocation negotiation model for transboundary rivers under scarcity,” Frontiers in Environmental Science, vol. 10, p. 900854, Aug. 2022, doi: 10.3389/fenvs.2022.900854.
[39] D. Juízo and R. Líden, “Modeling for transboundary water resources planning and allocation,” Hydrology and Earth System Sciences Discussions, vol. 5, no. 2, pp. 475–509, 2008. doi: 10.5194/hess-14-2343-2010
[40] Babel, Mukand & Das Gupta, Ashim & Nayak, D.. (2005). A Model for Optimal Allocation of Water to Competing Demands. Water Resources Management. 19. 693-712. doi: 10.1007/s11269-005-3282-4
[41] Karner, Katrin & Schmid, Erwin & Schneider, Uwe & Mitter, Hermine. (2021). Computing stochastic Pareto frontiers between economic and environmental goals for a semi-arid agricultural production region in Austria. Ecological Economics. 185. 107044. doi: 10.1016/j.ecolecon.2021.107044
[42] Rey, D., Pérez-Blanco, C. D., Escriva-Bou, A., Girard, C., & Veldkamp, T. I. E. (2018). Role of economic instruments in water allocation reform: lessons from Europe. International Journal of Water Resources Development, 35(2), 206–239. doi: 10.1080/07900627.2017.1422702
[43] F. Li, “Fair and Reasonable Allocation of Trans-Boundary Water Resources Based on an Asymmetric Nash Negotiation Model from the Satisfaction Perspective: A Case Study for the Lancang–Mekong River Basin,” Water, vol. 12, no. 11, p. 3001, 2020.
Leave a Reply